Candlestick patterns are a crucial tool for technical analysis, offering visual clues about market sentiment and potential price reversals or continuations. Recognizing these patterns can help traders identify optimal entry points for their trades. Below are some of the most powerful candlestick patterns to watch for when looking to enter the market:
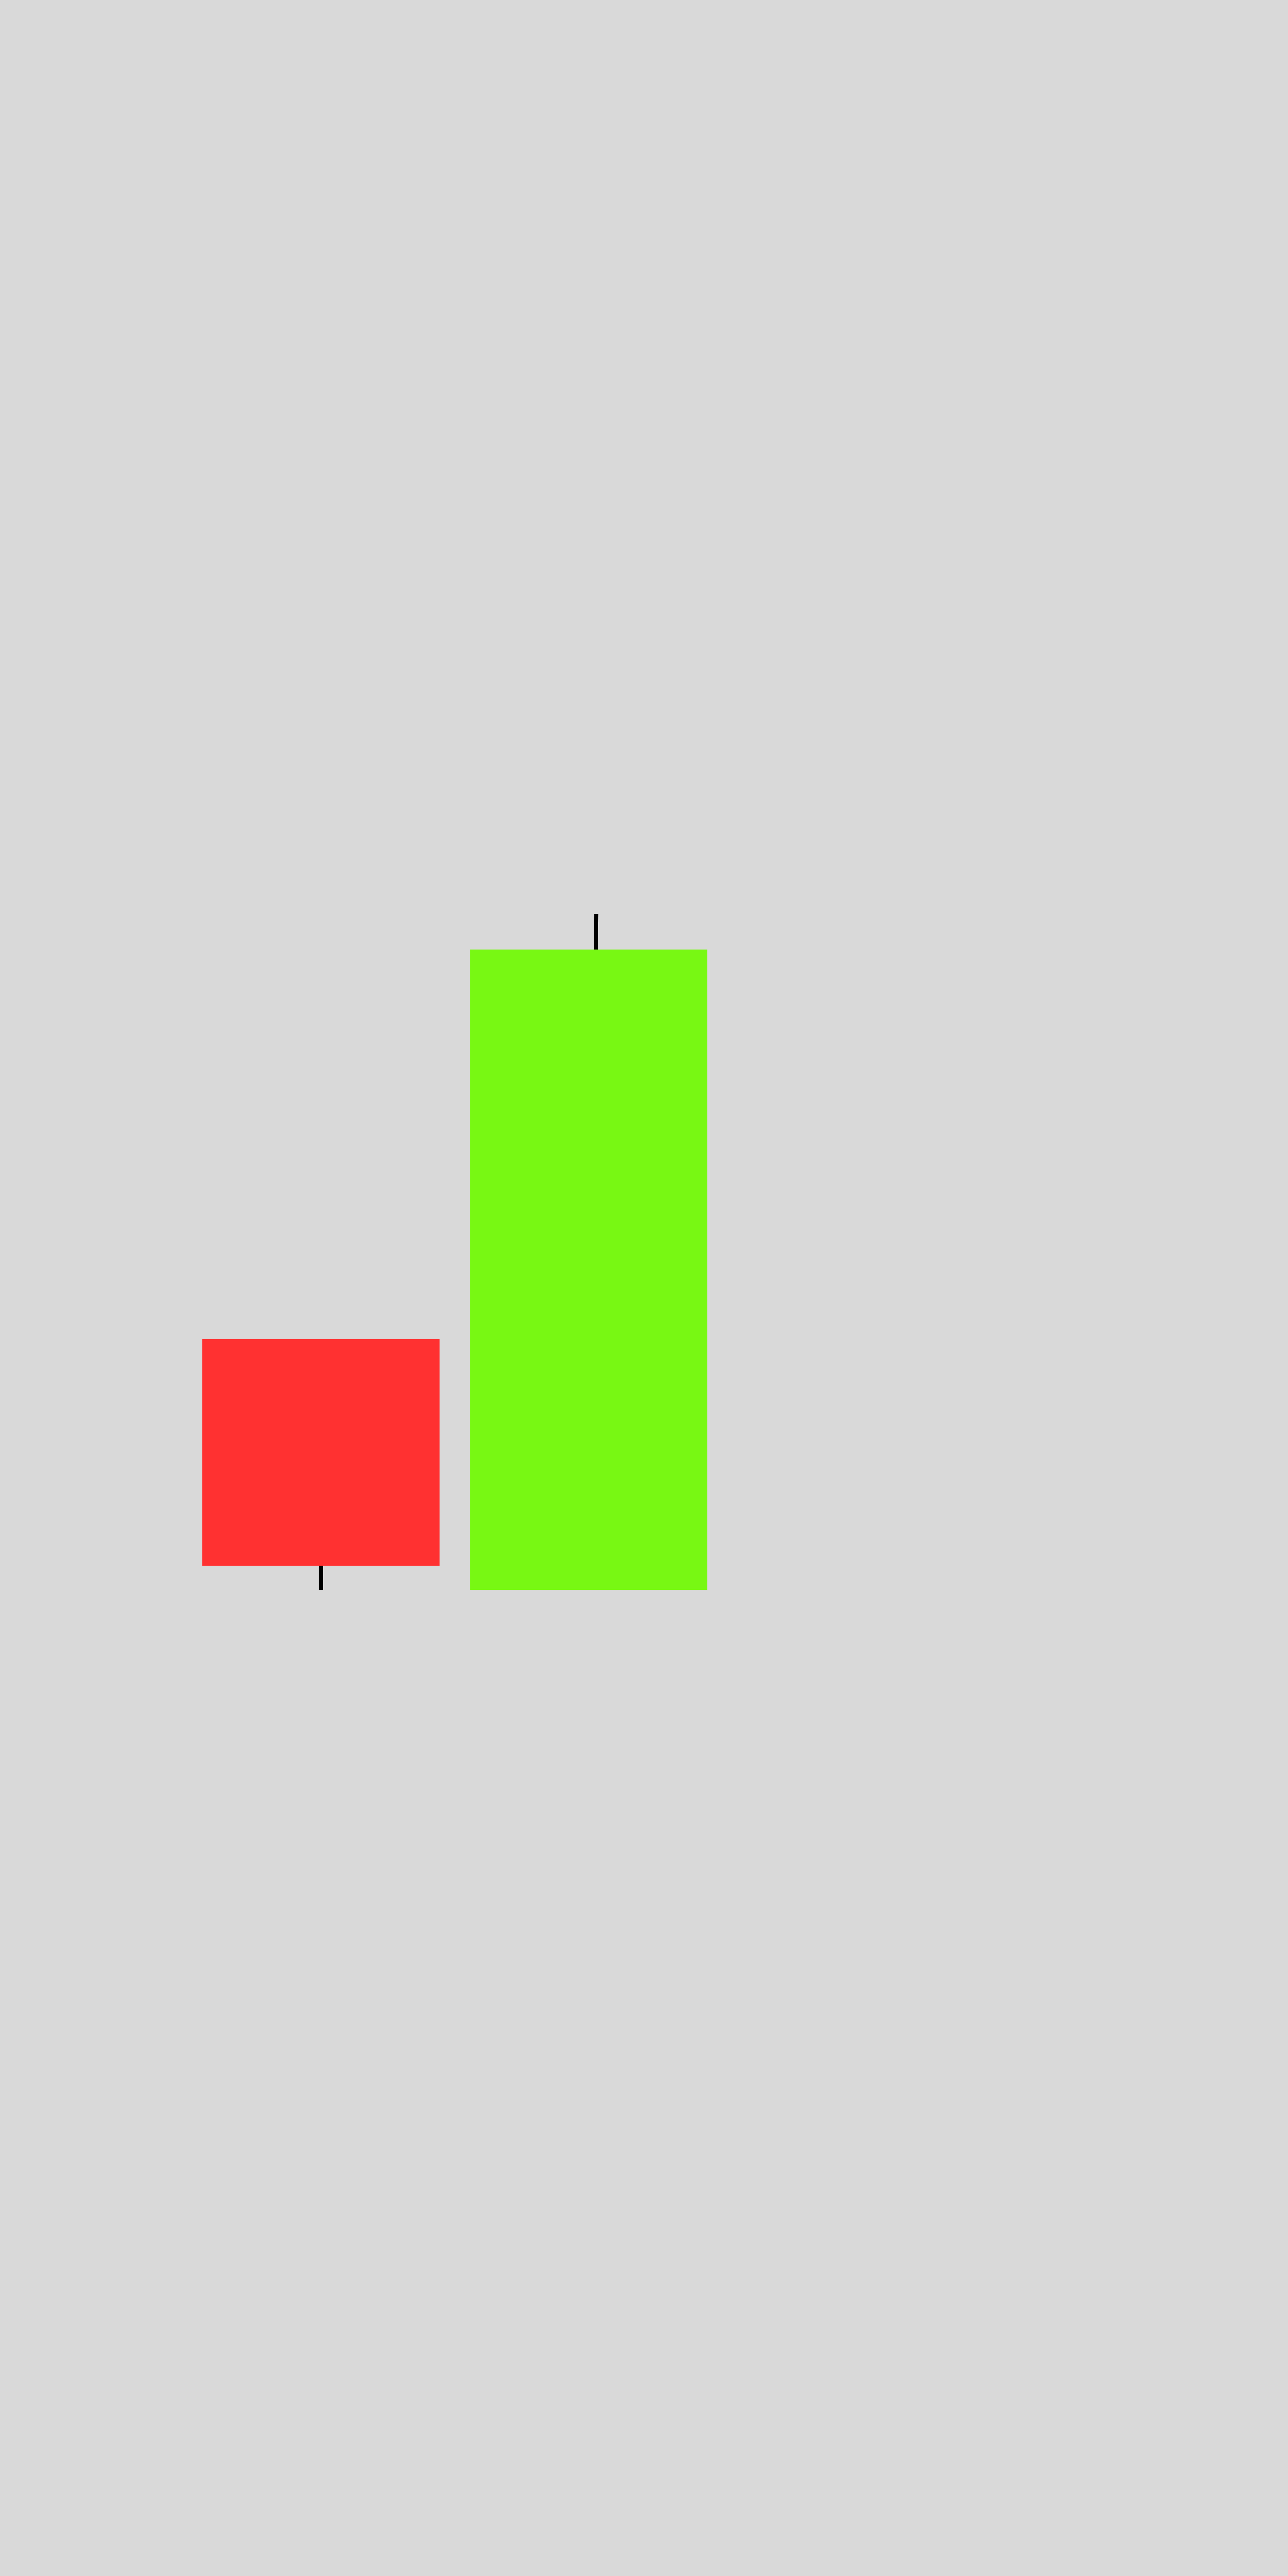
1. Bullish Engulfing Pattern
- Description: A bullish engulfing pattern forms when a smaller bearish candle is immediately followed by a larger bullish candle that completely engulfs the body of the previous candle.
- Significance: Indicates a potential reversal from a downtrend to an uptrend.
- Entry Point: Enter long after the bullish candle closes, preferably near the support level.
- Confirmation: Higher volume during the bullish candle enhances reliability.
2. Bearish Engulfing Pattern
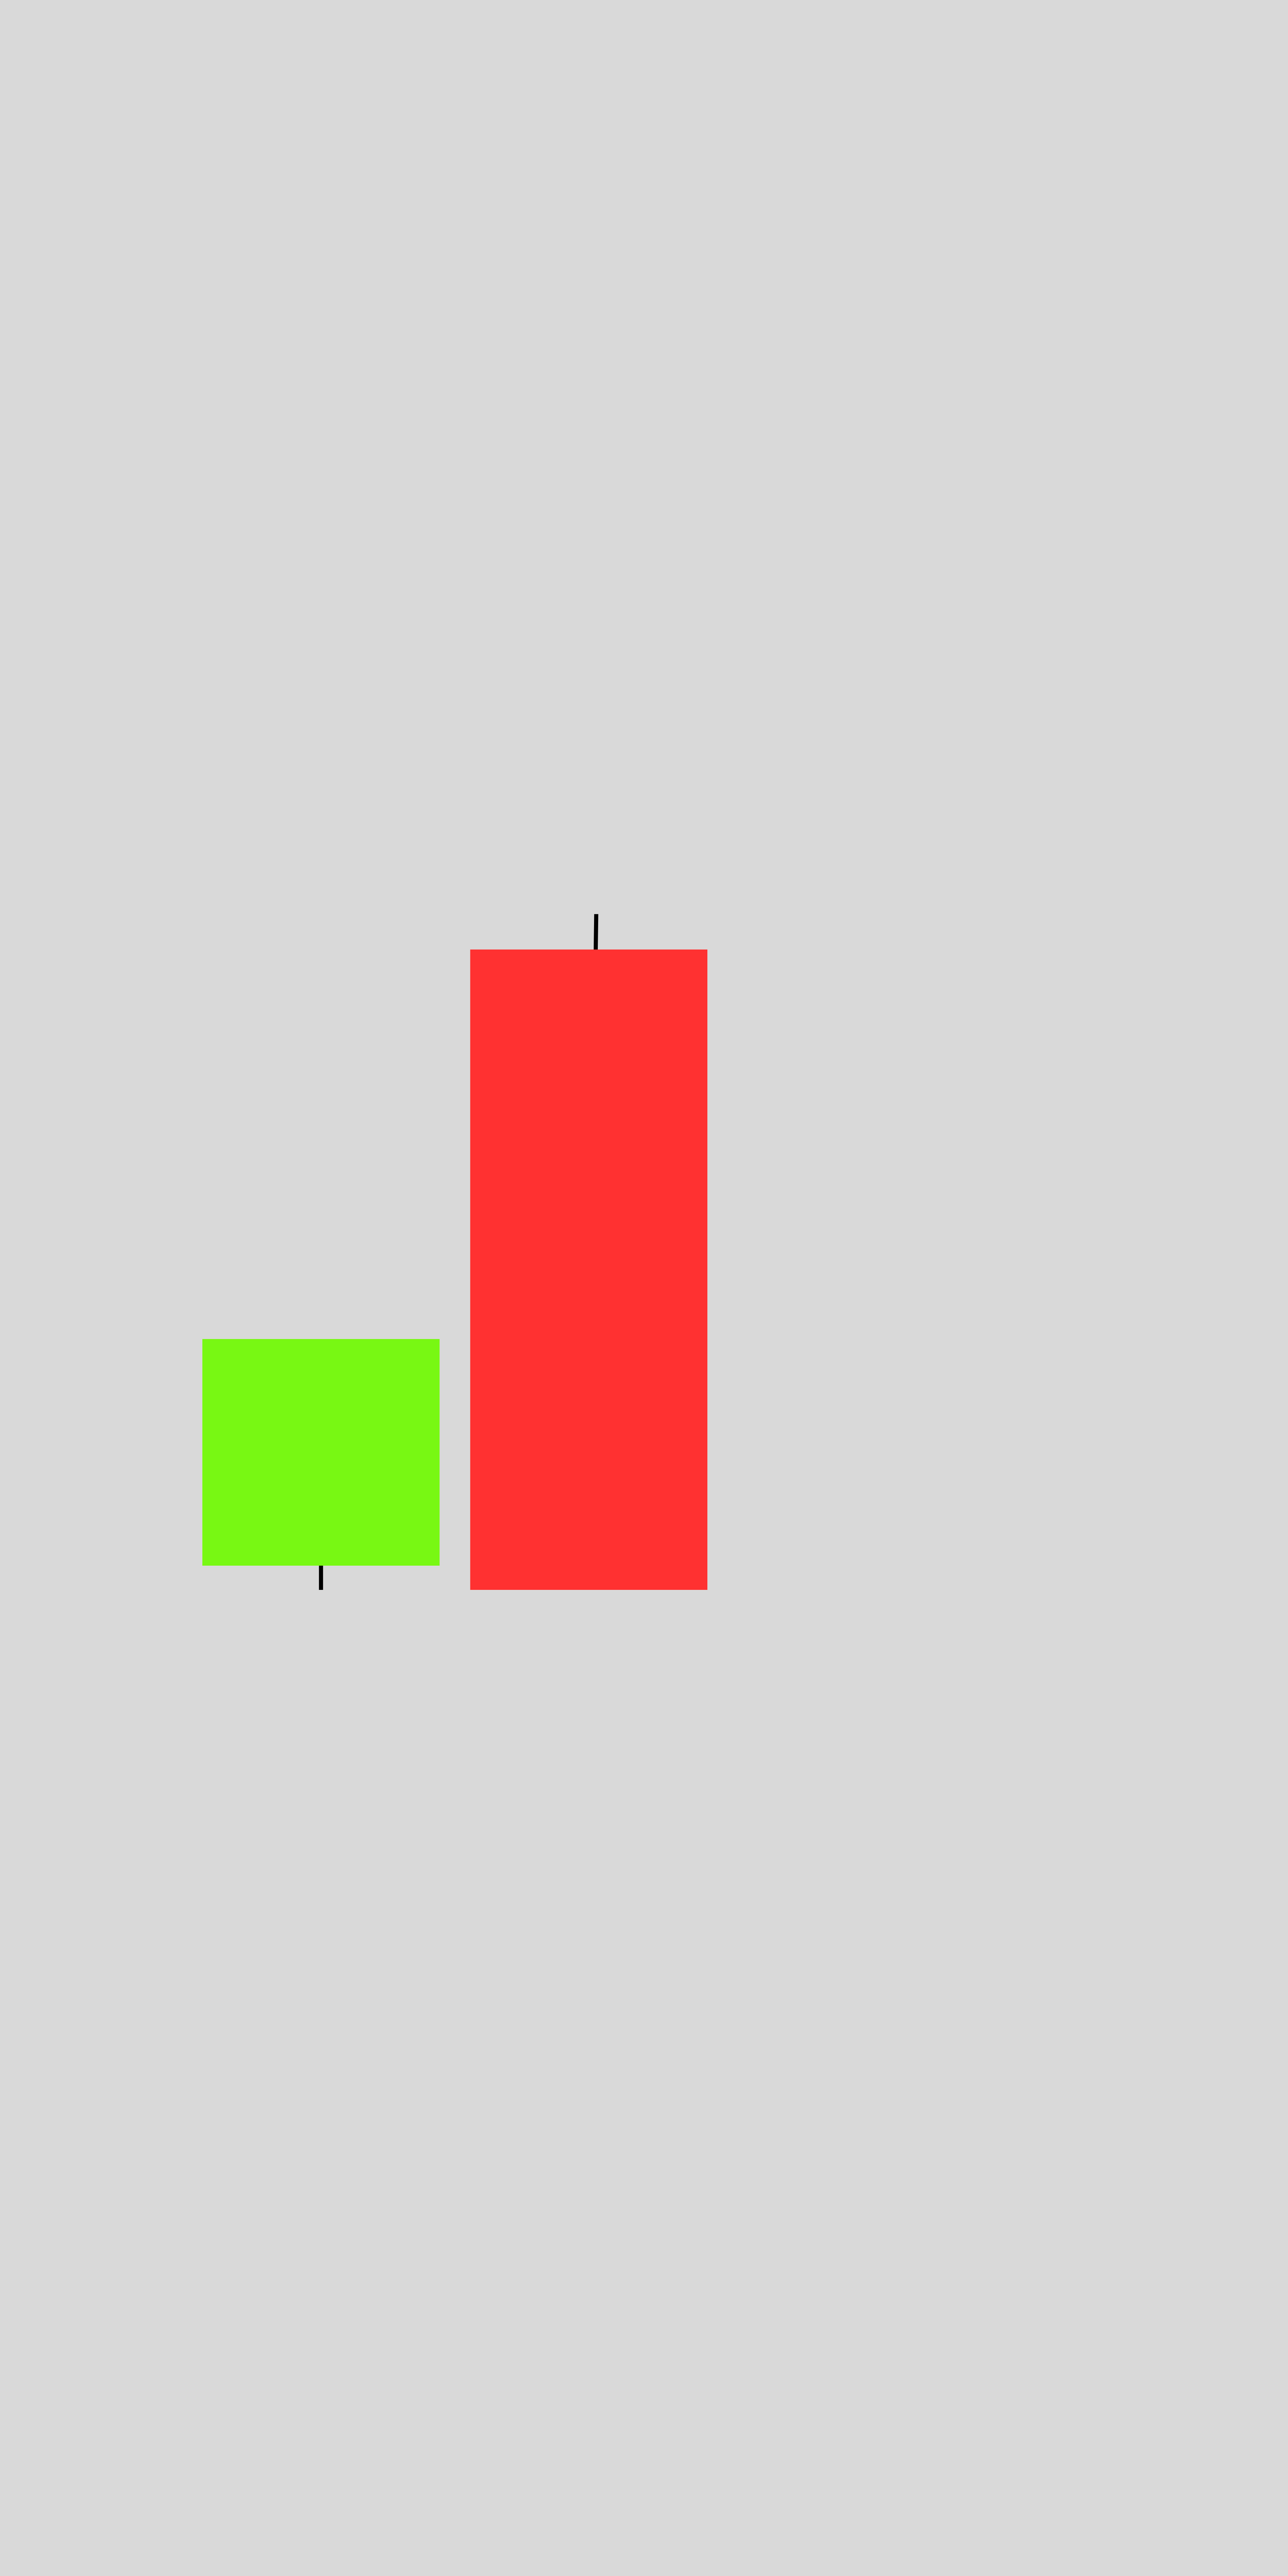
- Description: A bearish engulfing pattern occurs when a smaller bullish candle is followed by a larger bearish candle that engulfs the prior candle’s body.
- Significance: Signals a potential reversal from an uptrend to a downtrend.
- Entry Point: Enter short after the bearish candle closes, especially near resistance levels.
- Confirmation: Look for higher volume on the bearish candle for added strength.
3. Hammer (Bullish Reversal)
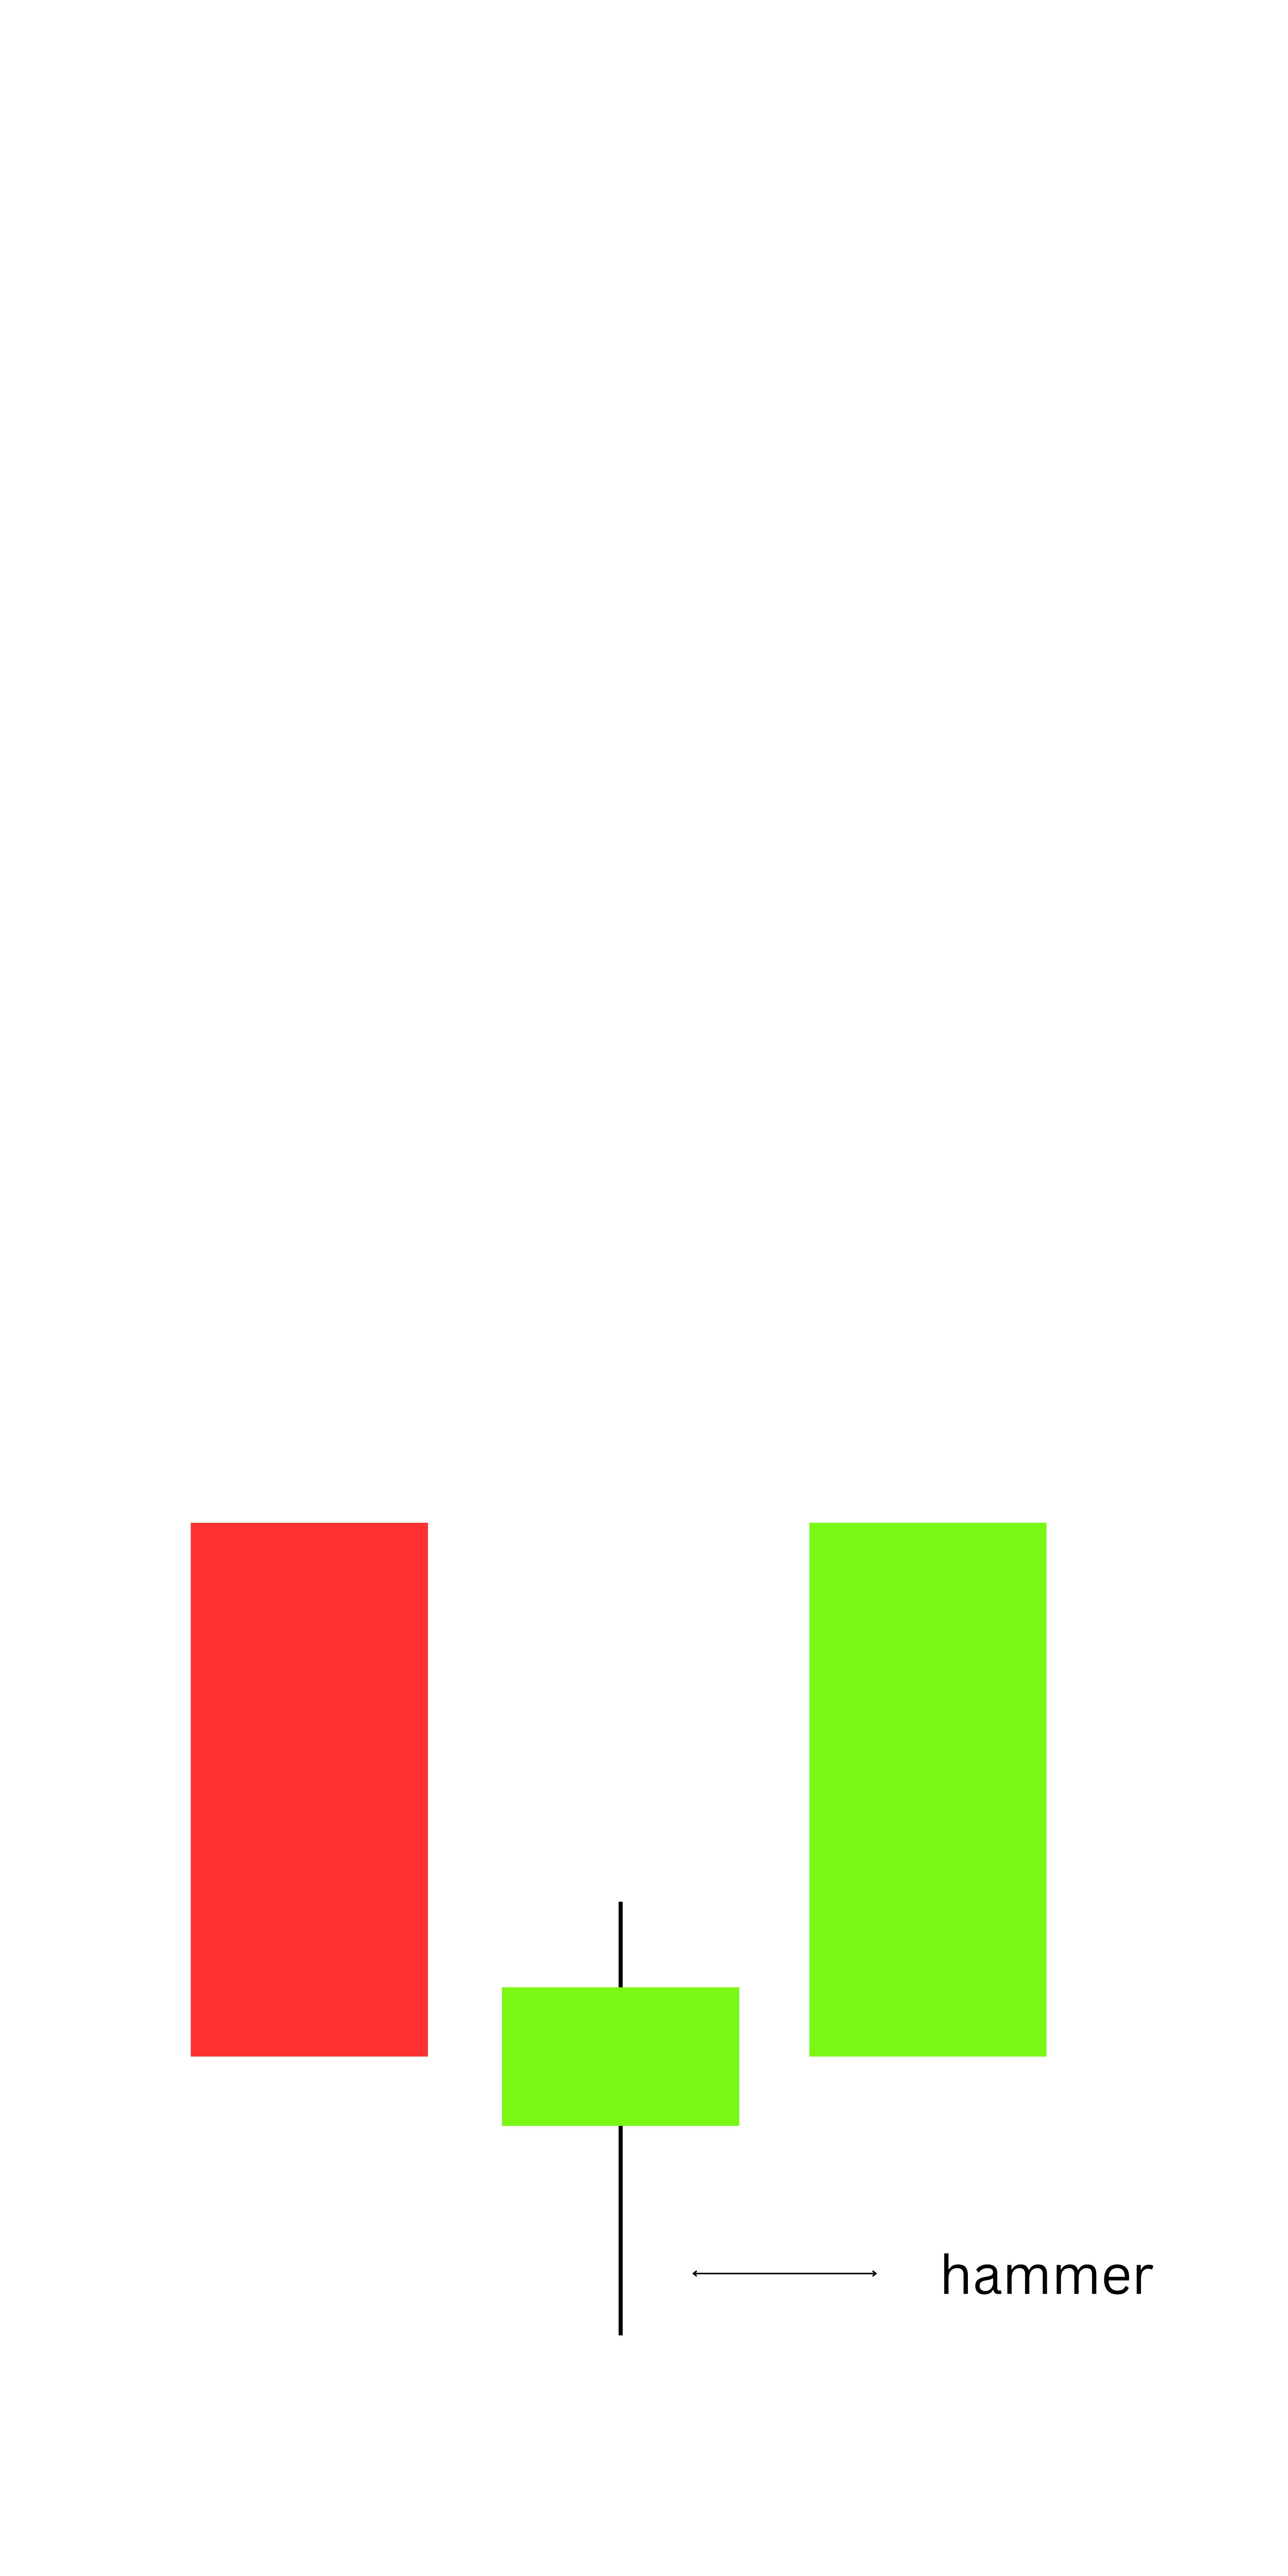
- Description: A hammer has a small real body at the top with a long lower wick, indicating rejection of lower prices.
- Significance: Signals a potential reversal to the upside after a downtrend.
- Entry Point: Enter long after the hammer is confirmed by the next bullish candle.
- Confirmation: Ensure the lower wick is at least twice the size of the body.
4. Shooting Star (Bearish Reversal)
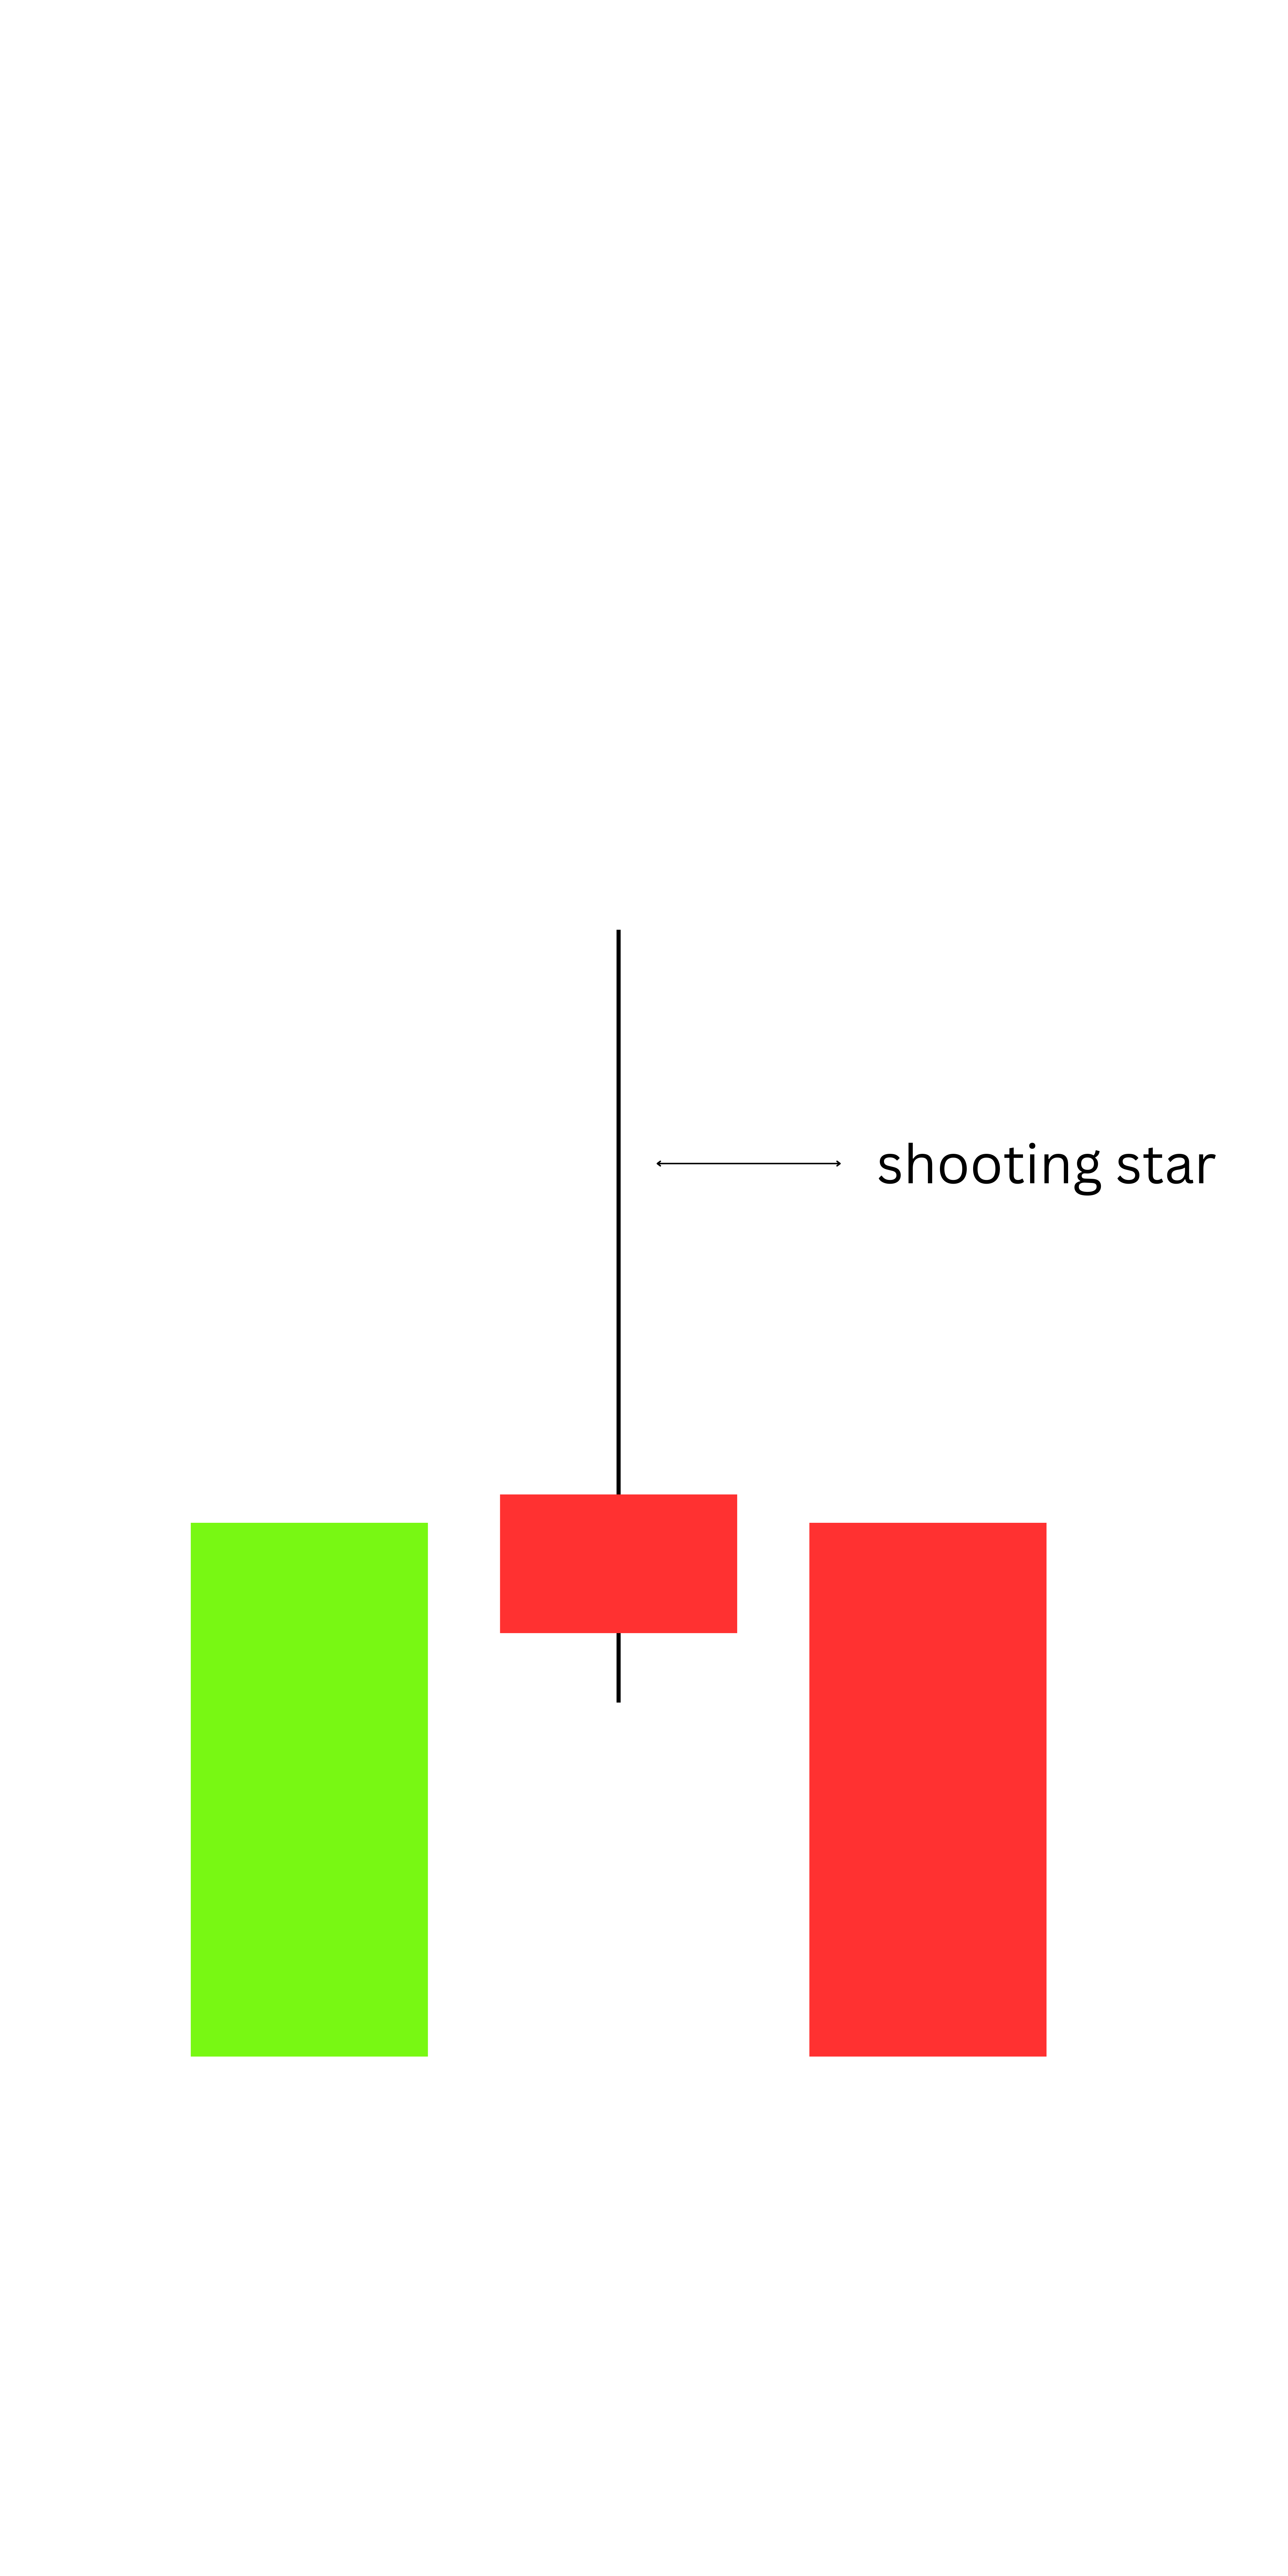
- Description: A shooting star has a small real body at the bottom with a long upper wick, showing rejection of higher prices.
- Significance: Suggests a reversal to the downside after an uptrend.
- Entry Point: Enter short after the shooting star is confirmed by the next bearish candle.
- Confirmation: The upper wick should be at least twice the size of the body.
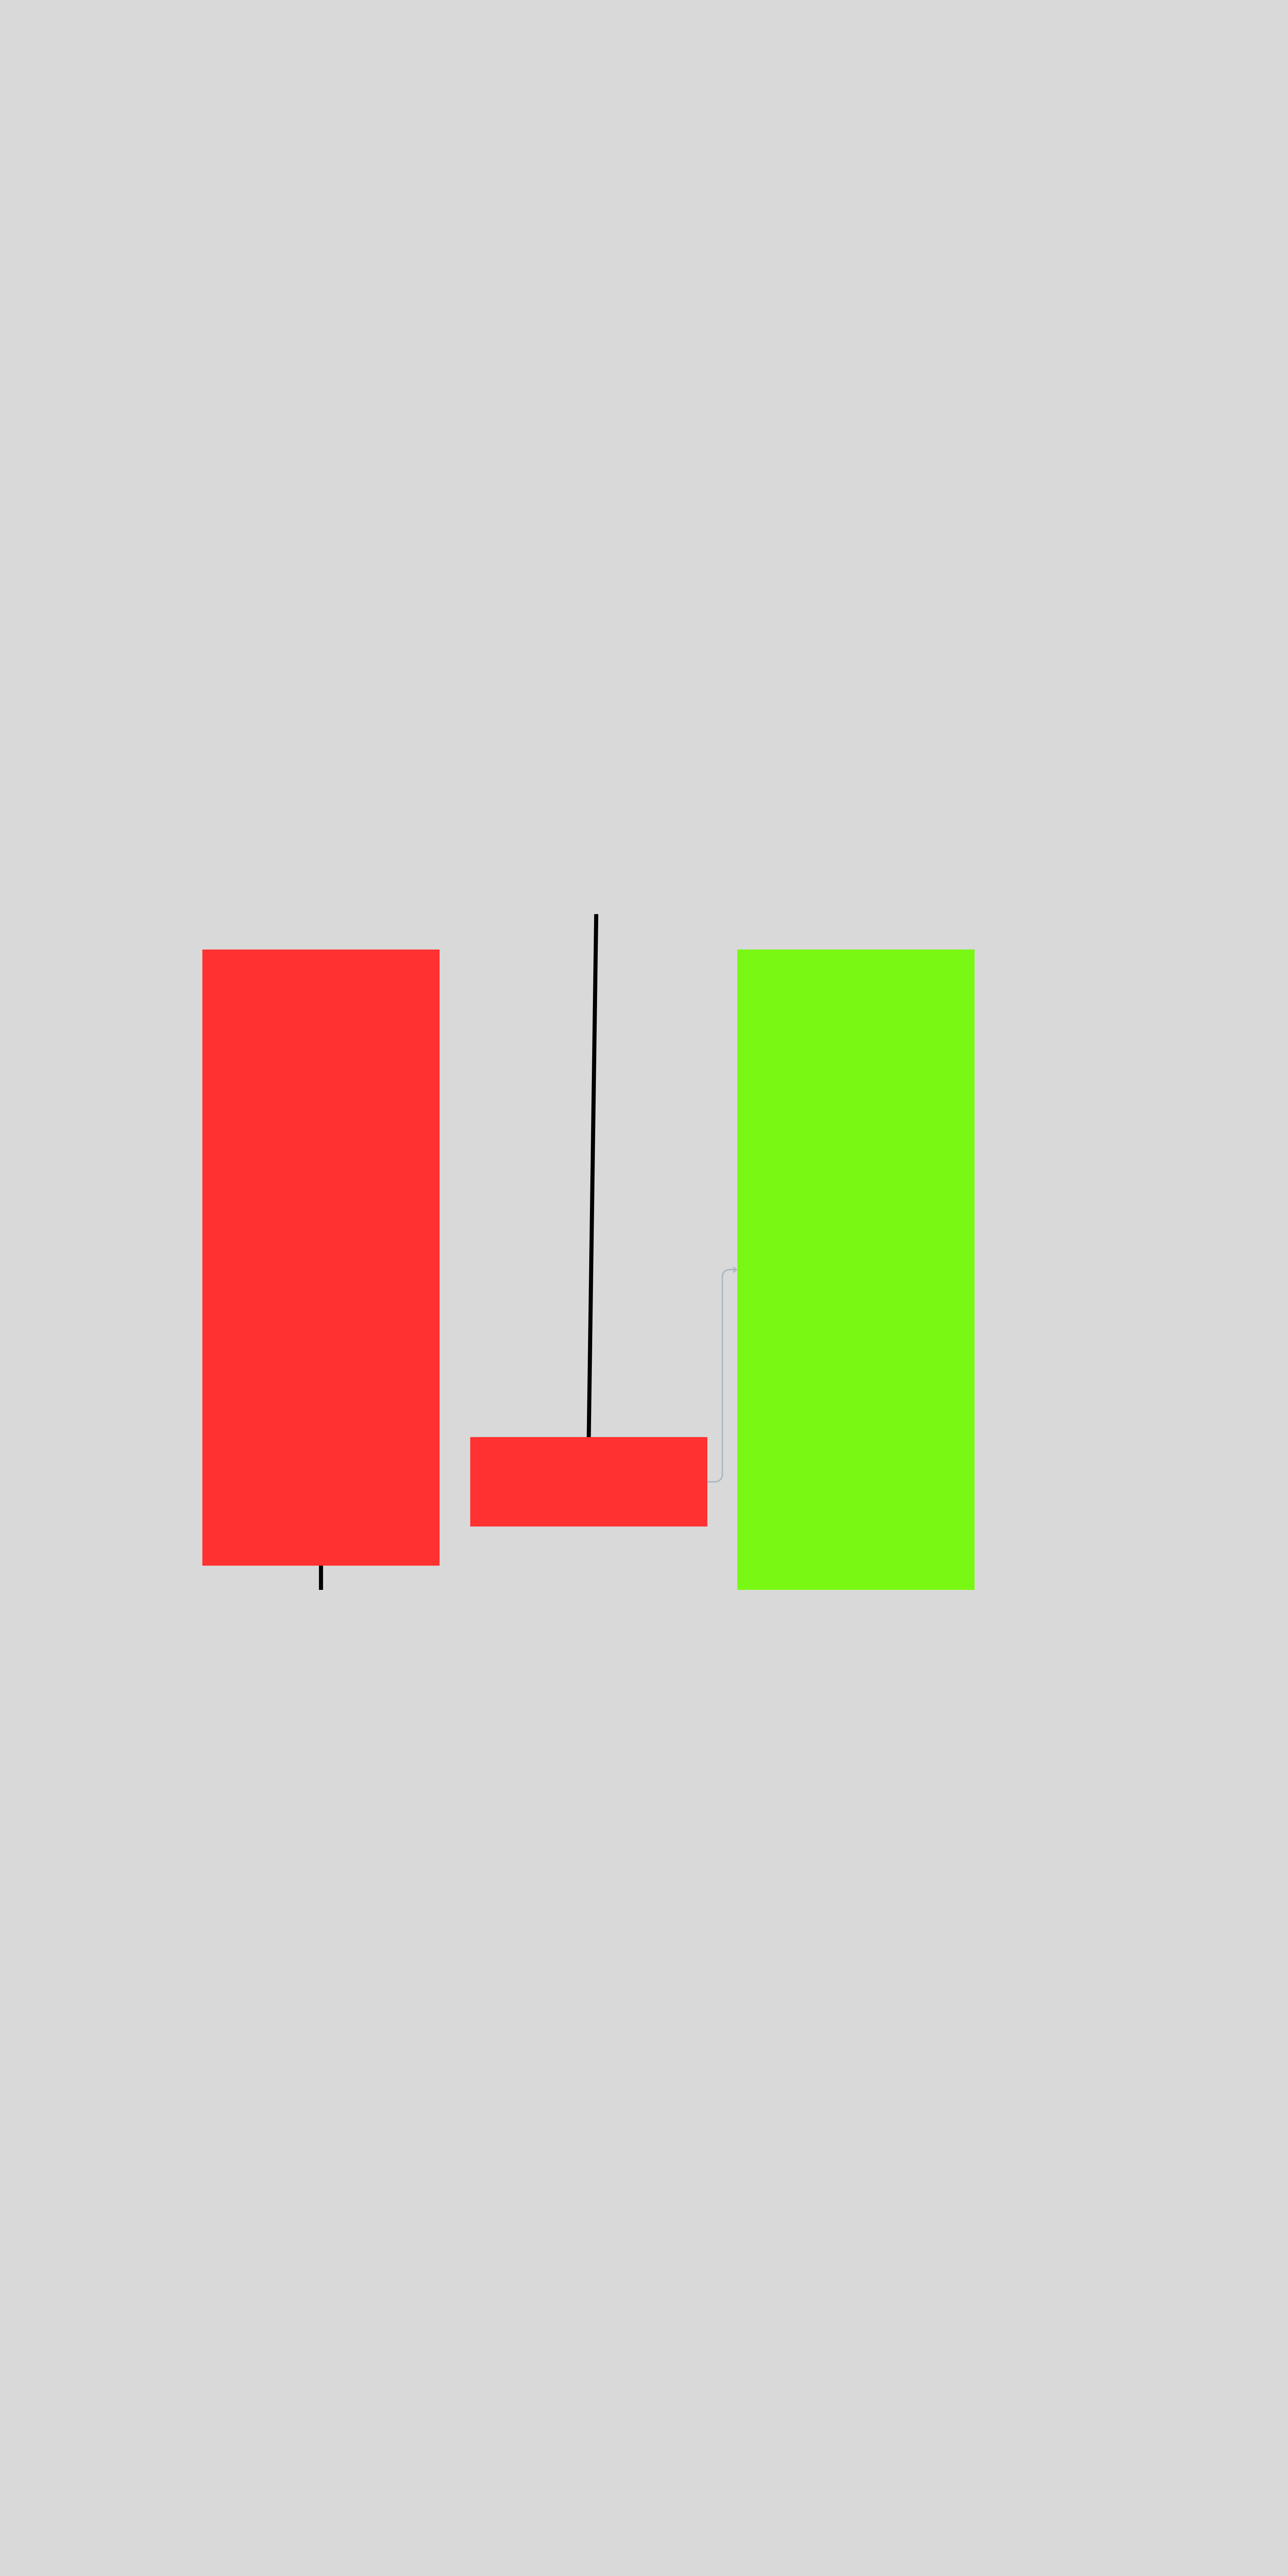
5. Morning Star (Bullish Reversal)
- Description: A three-candle pattern where a bearish candle is followed by a small-bodied indecision candle (e.g., a Doji), and then a bullish candle closes above the midpoint of the first candle.
- Significance: Indicates a reversal to the upside.
- Entry Point: Enter long after the bullish confirmation candle closes.
- Confirmation: Ensure the bullish candle has significant momentum.
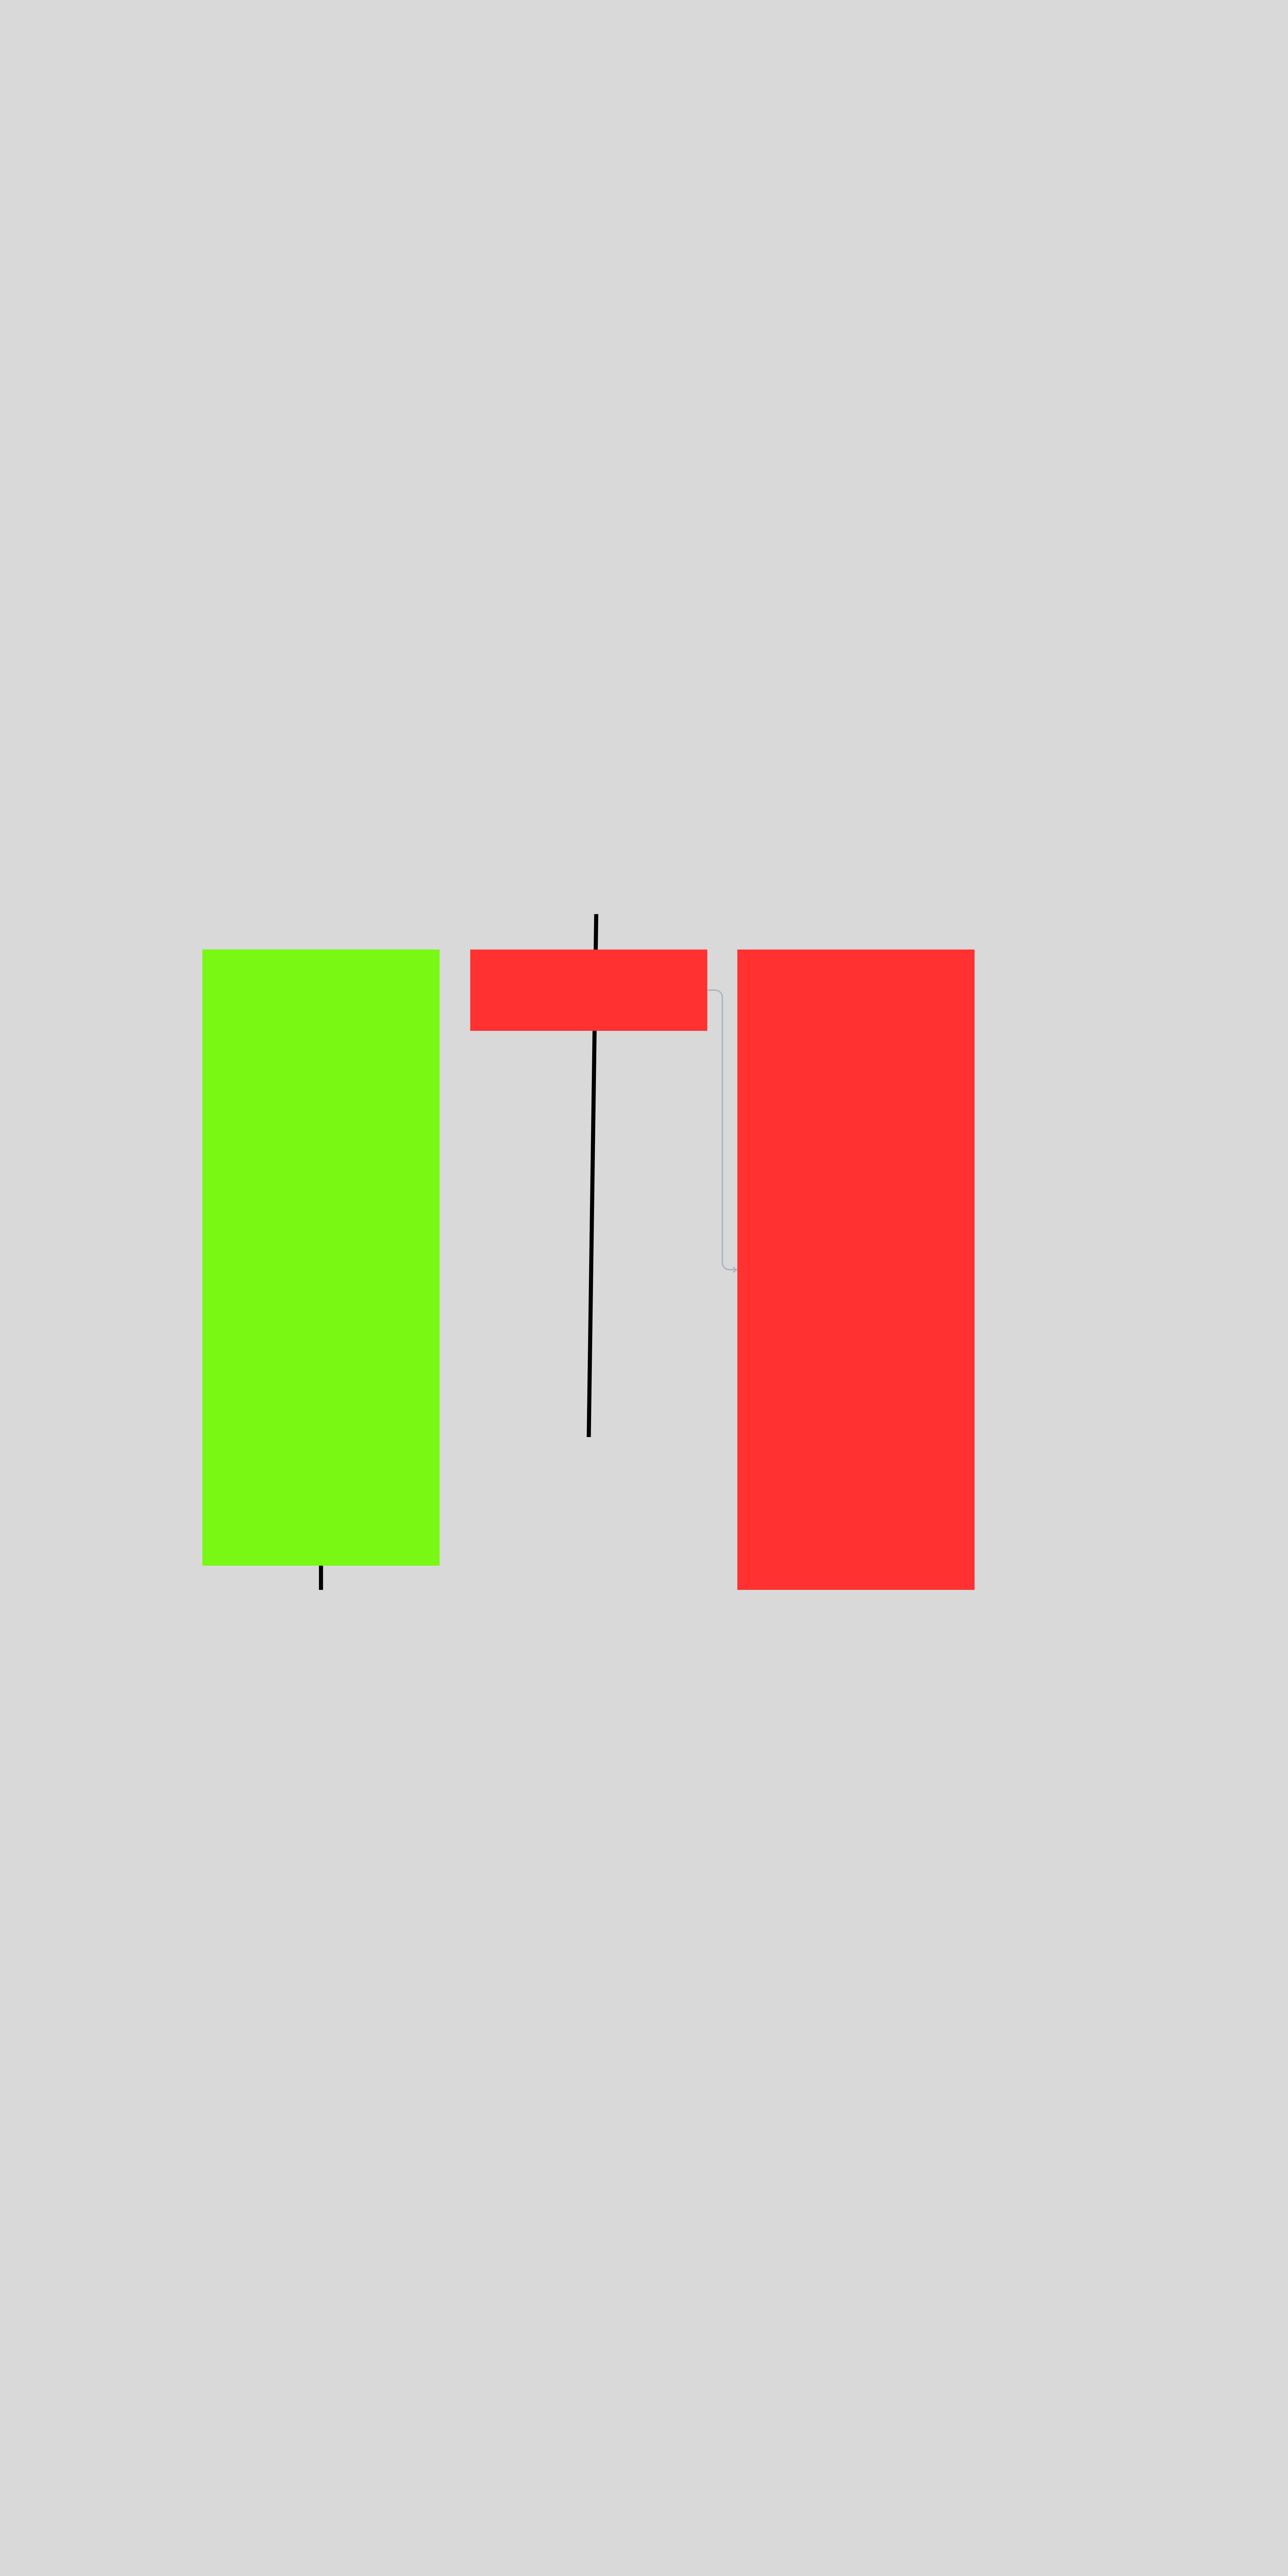
6. Evening Star (Bearish Reversal)
- Description: The evening star is the bearish counterpart of the morning star. It features a bullish candle, followed by a small-bodied indecision candle, and then a bearish candle that closes below the midpoint of the first candle.
- Significance: Signals a potential reversal to the downside.
- Entry Point: Enter short after the bearish confirmation candle closes.
- Confirmation: Watch for increased volume during the bearish candle.
7. Doji Candlestick
- Description: A Doji has little to no real body, indicating indecision in the market.
- Significance: Often precedes a reversal or significant breakout, depending on the trend.
- Entry Point: Combine with other indicators or wait for confirmation of the breakout direction.

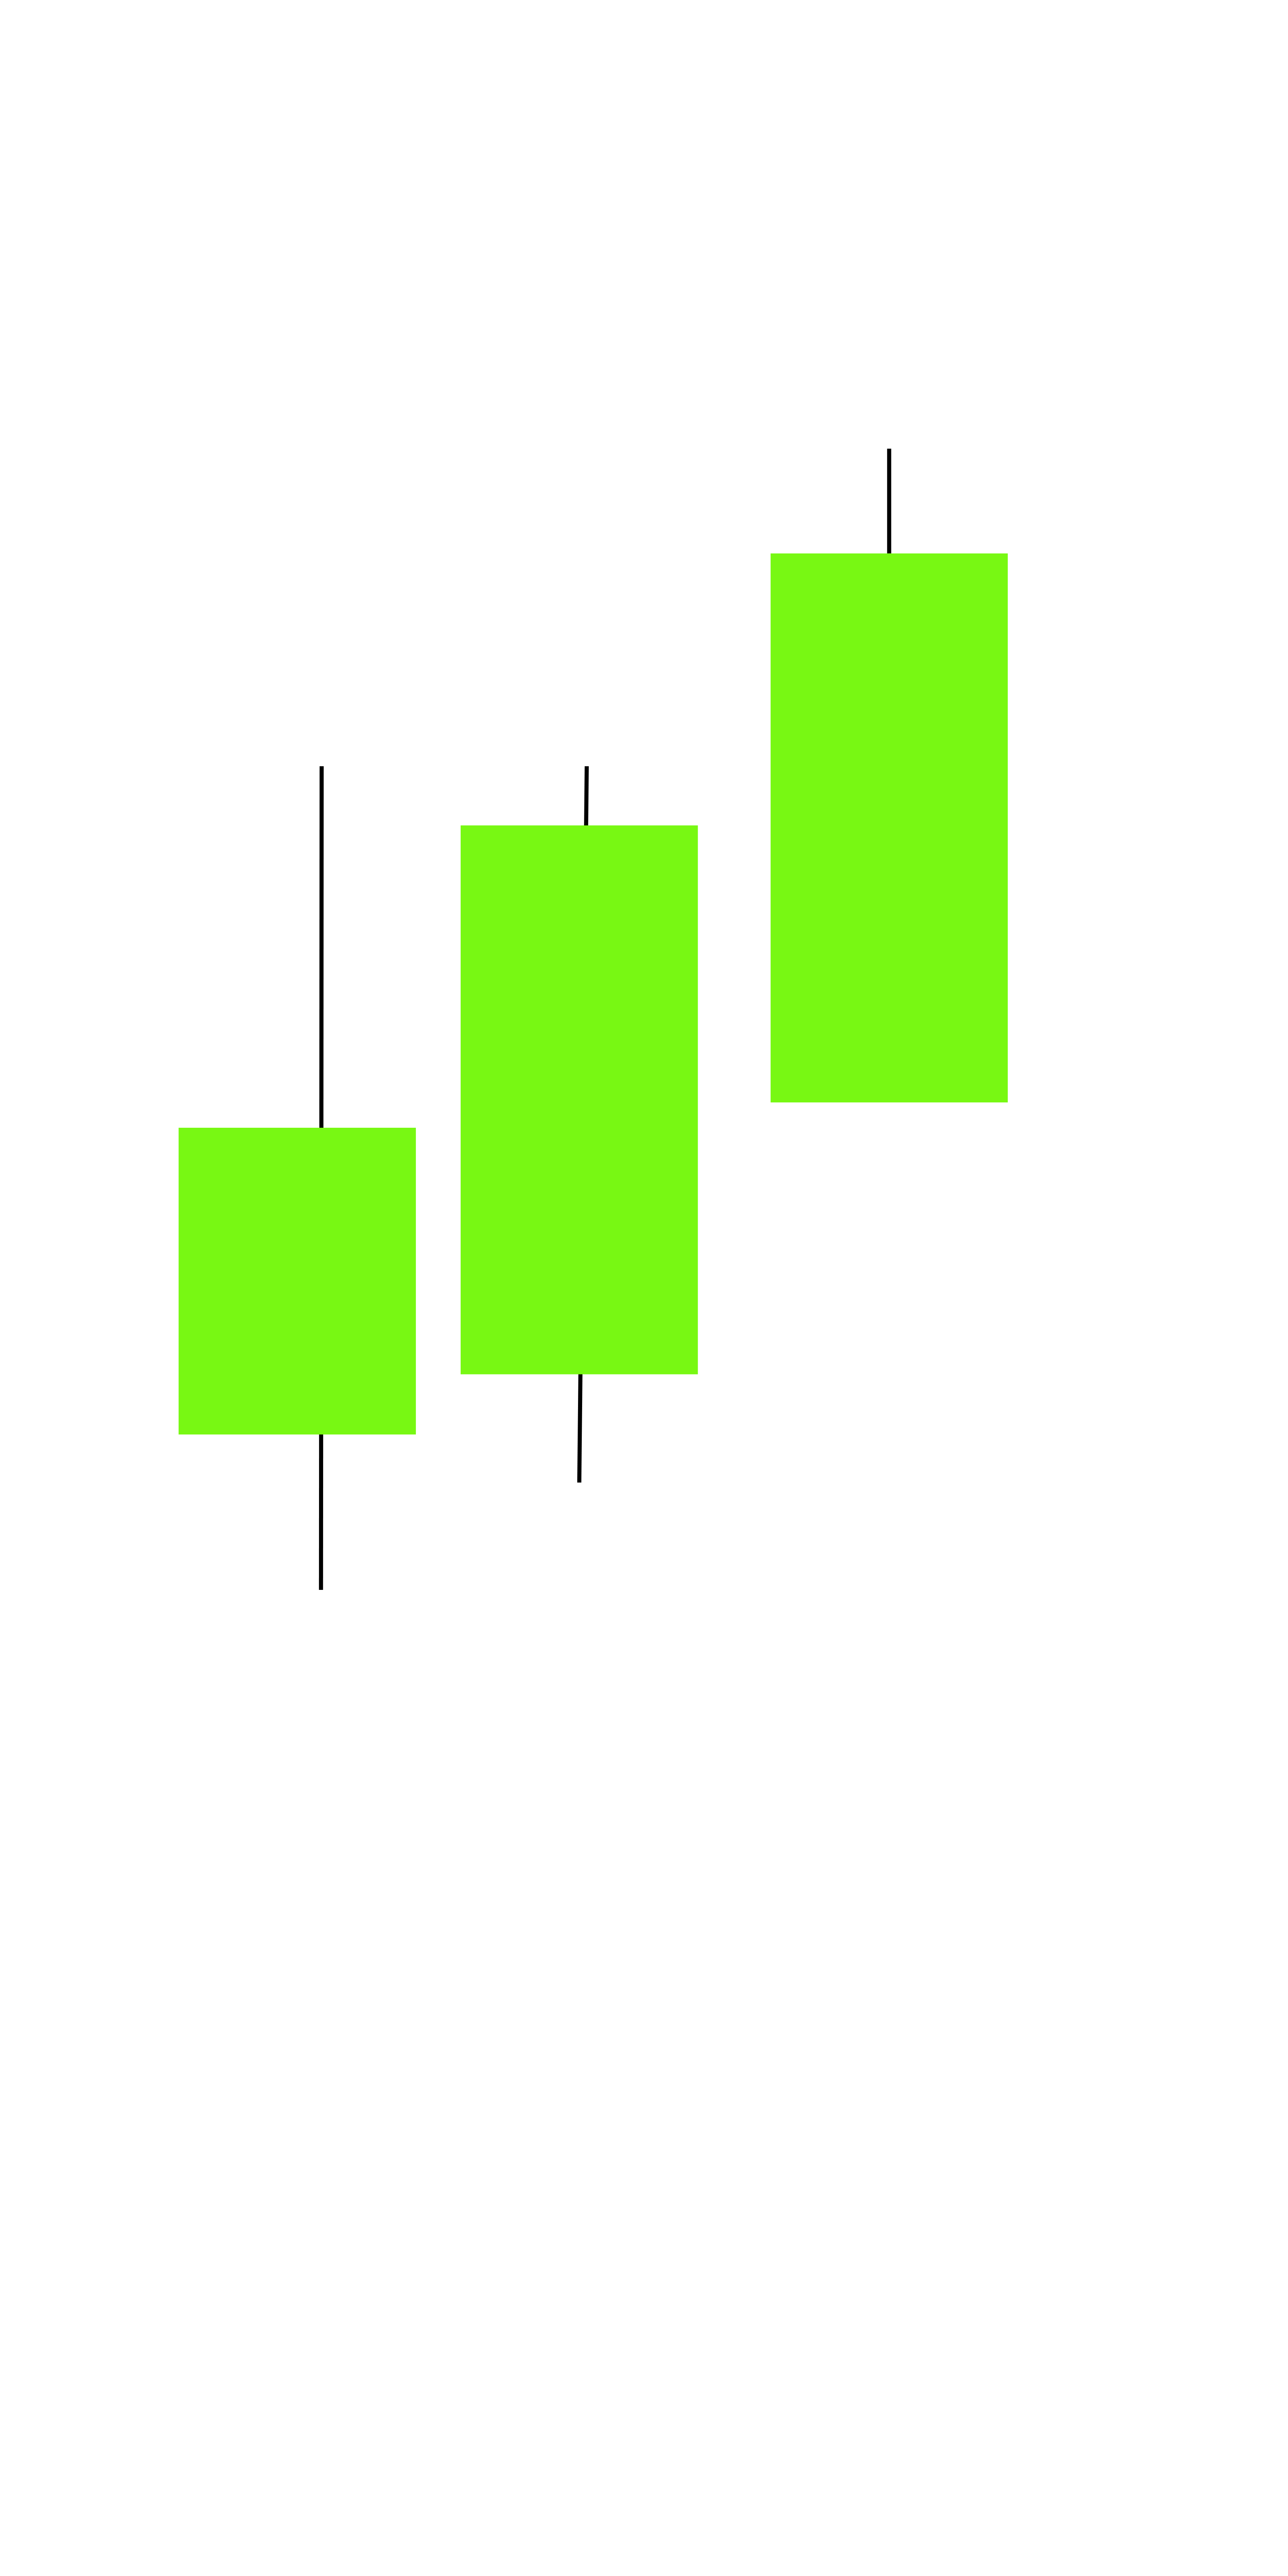
8. Three White Soldiers (Bullish Continuation)
- Description: A pattern consisting of three consecutive bullish candles with higher closes, often appearing after a downtrend.
- Significance: Suggests a strong continuation of the uptrend.
- Entry Point: Enter long after the third candle closes, or after a minor pullback.
- Confirmation: Each candle should have minimal upper wicks, indicating strong buying pressure.
9. Three Black Crows (Bearish Continuation)
- Description: The opposite of three white soldiers, this pattern consists of three consecutive bearish candles with lower closes.
- Significance: Indicates a continuation of a downtrend.
- Entry Point: Enter short after the third candle closes, or after a slight retracement.
- Confirmation: Small or non-existent lower wicks suggest strong selling pressure.
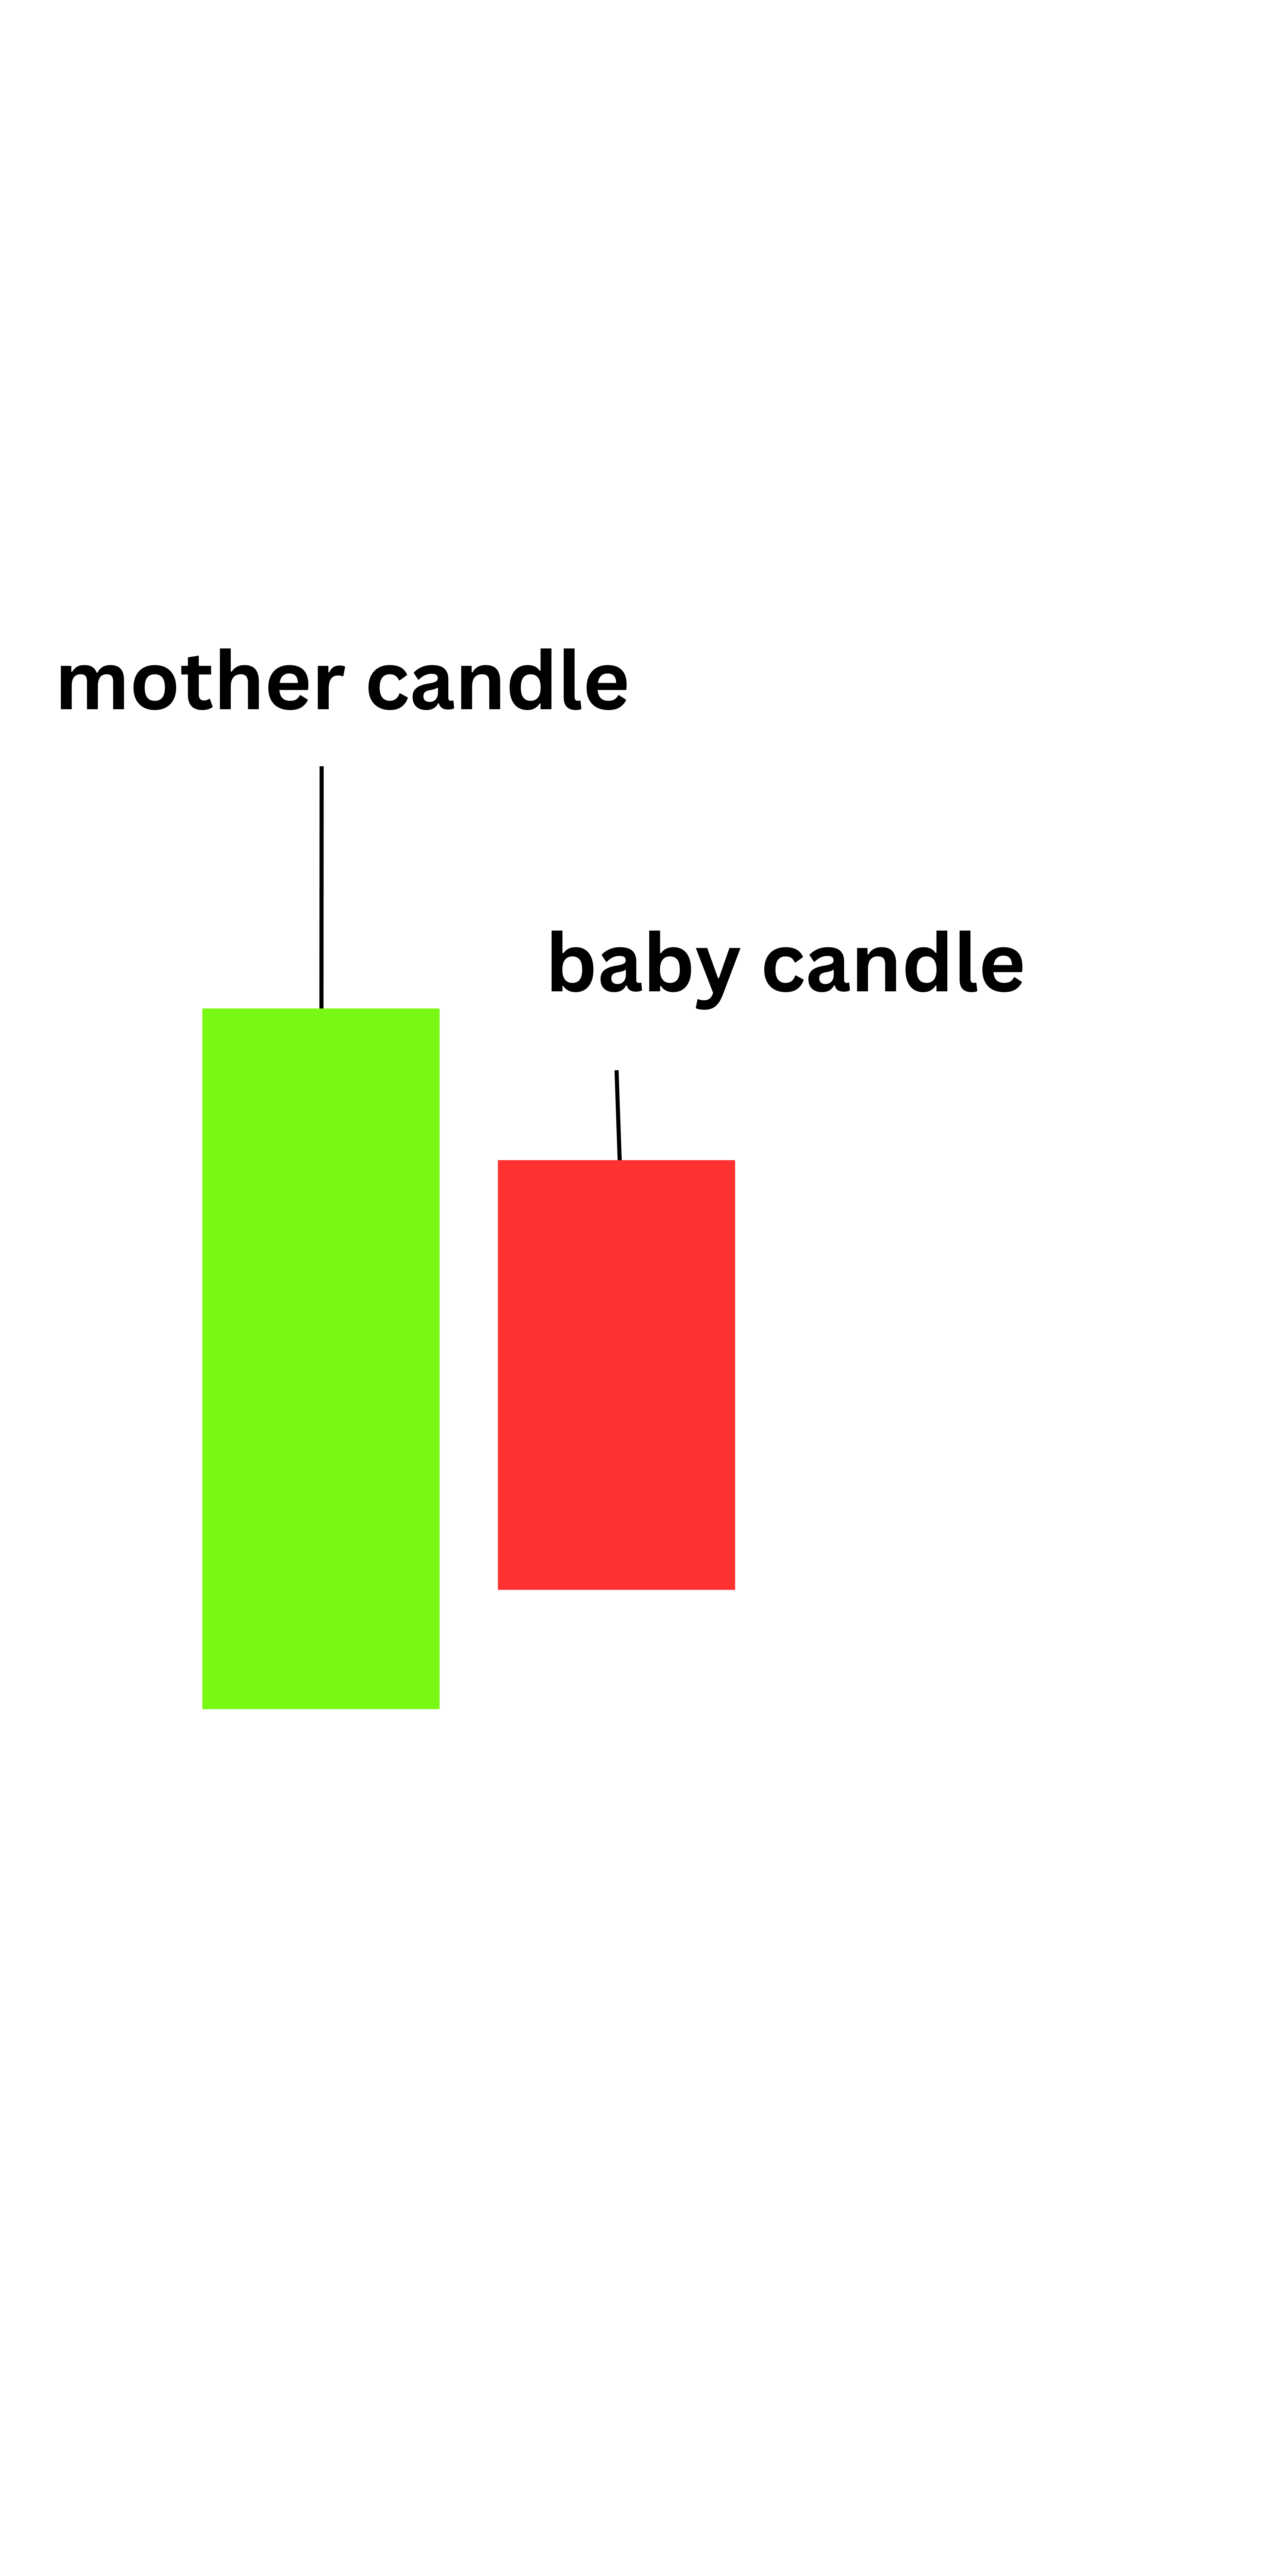
10. Harami Pattern (Bullish or Bearish Reversal)
- Description: A harami occurs when a smaller candle is entirely within the body of the previous larger candle.
- Bullish Harami: Appears during a downtrend and signals potential reversal upwards.
- Bearish Harami: Appears during an uptrend and signals potential reversal downwards.
- Significance: Suggests market indecision and a possible trend reversal.
- Entry Point: Enter after the trend direction is confirmed by the next candle.
11. Tweezer Tops and Bottoms
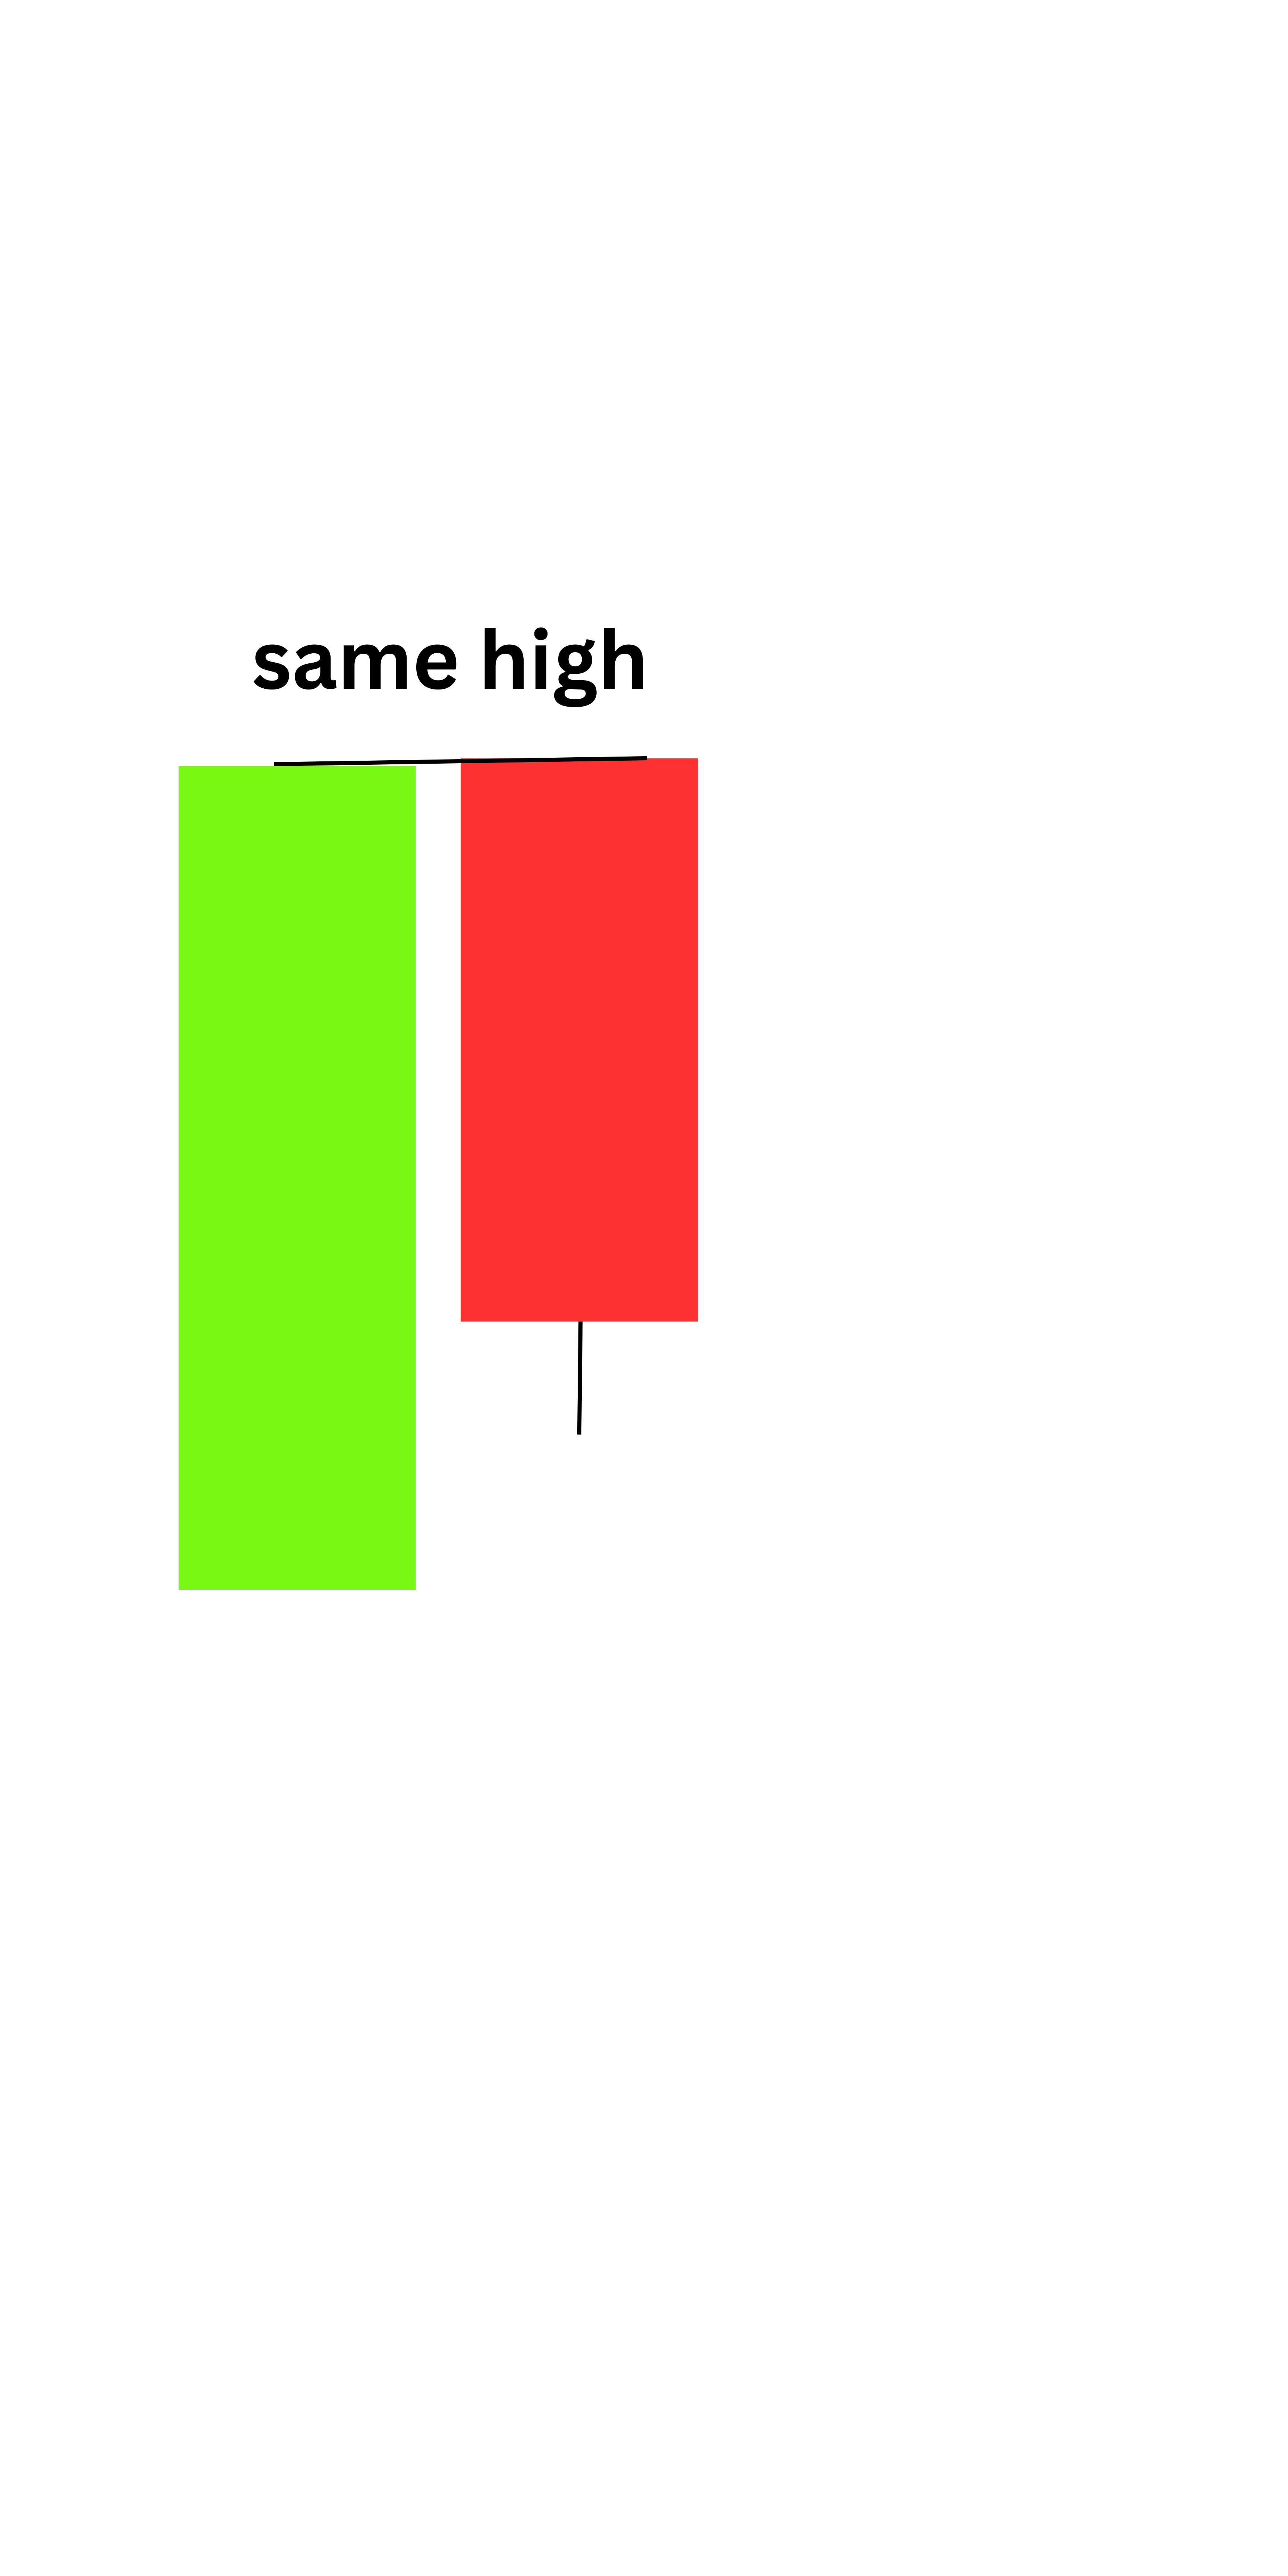
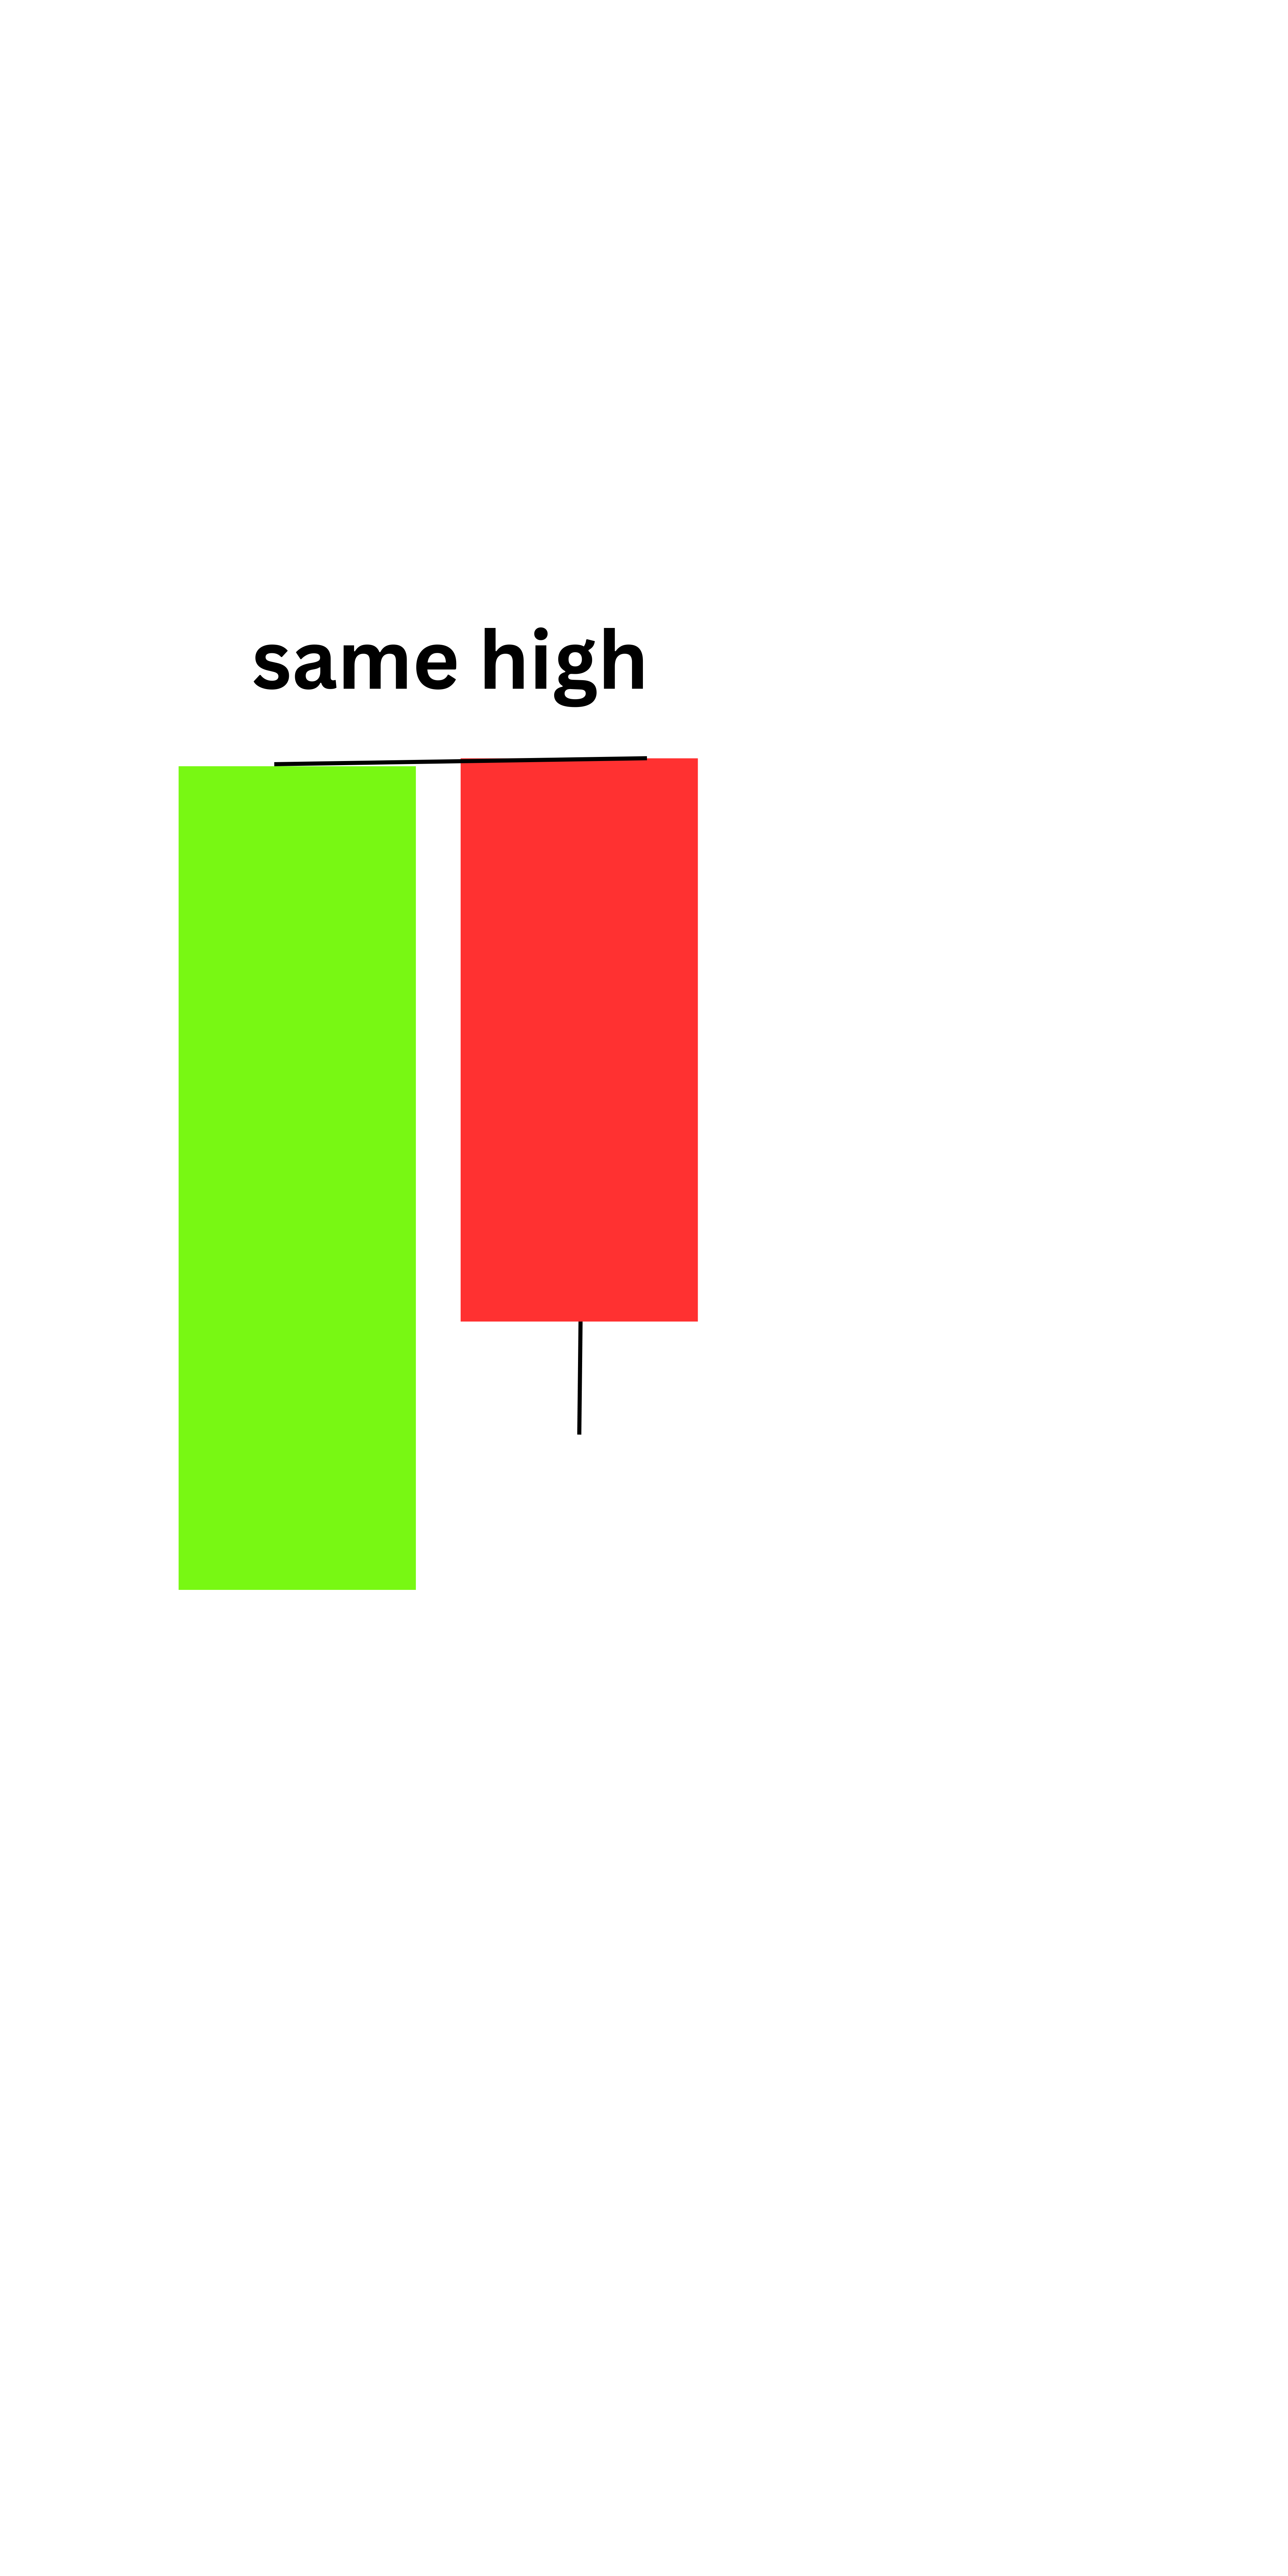
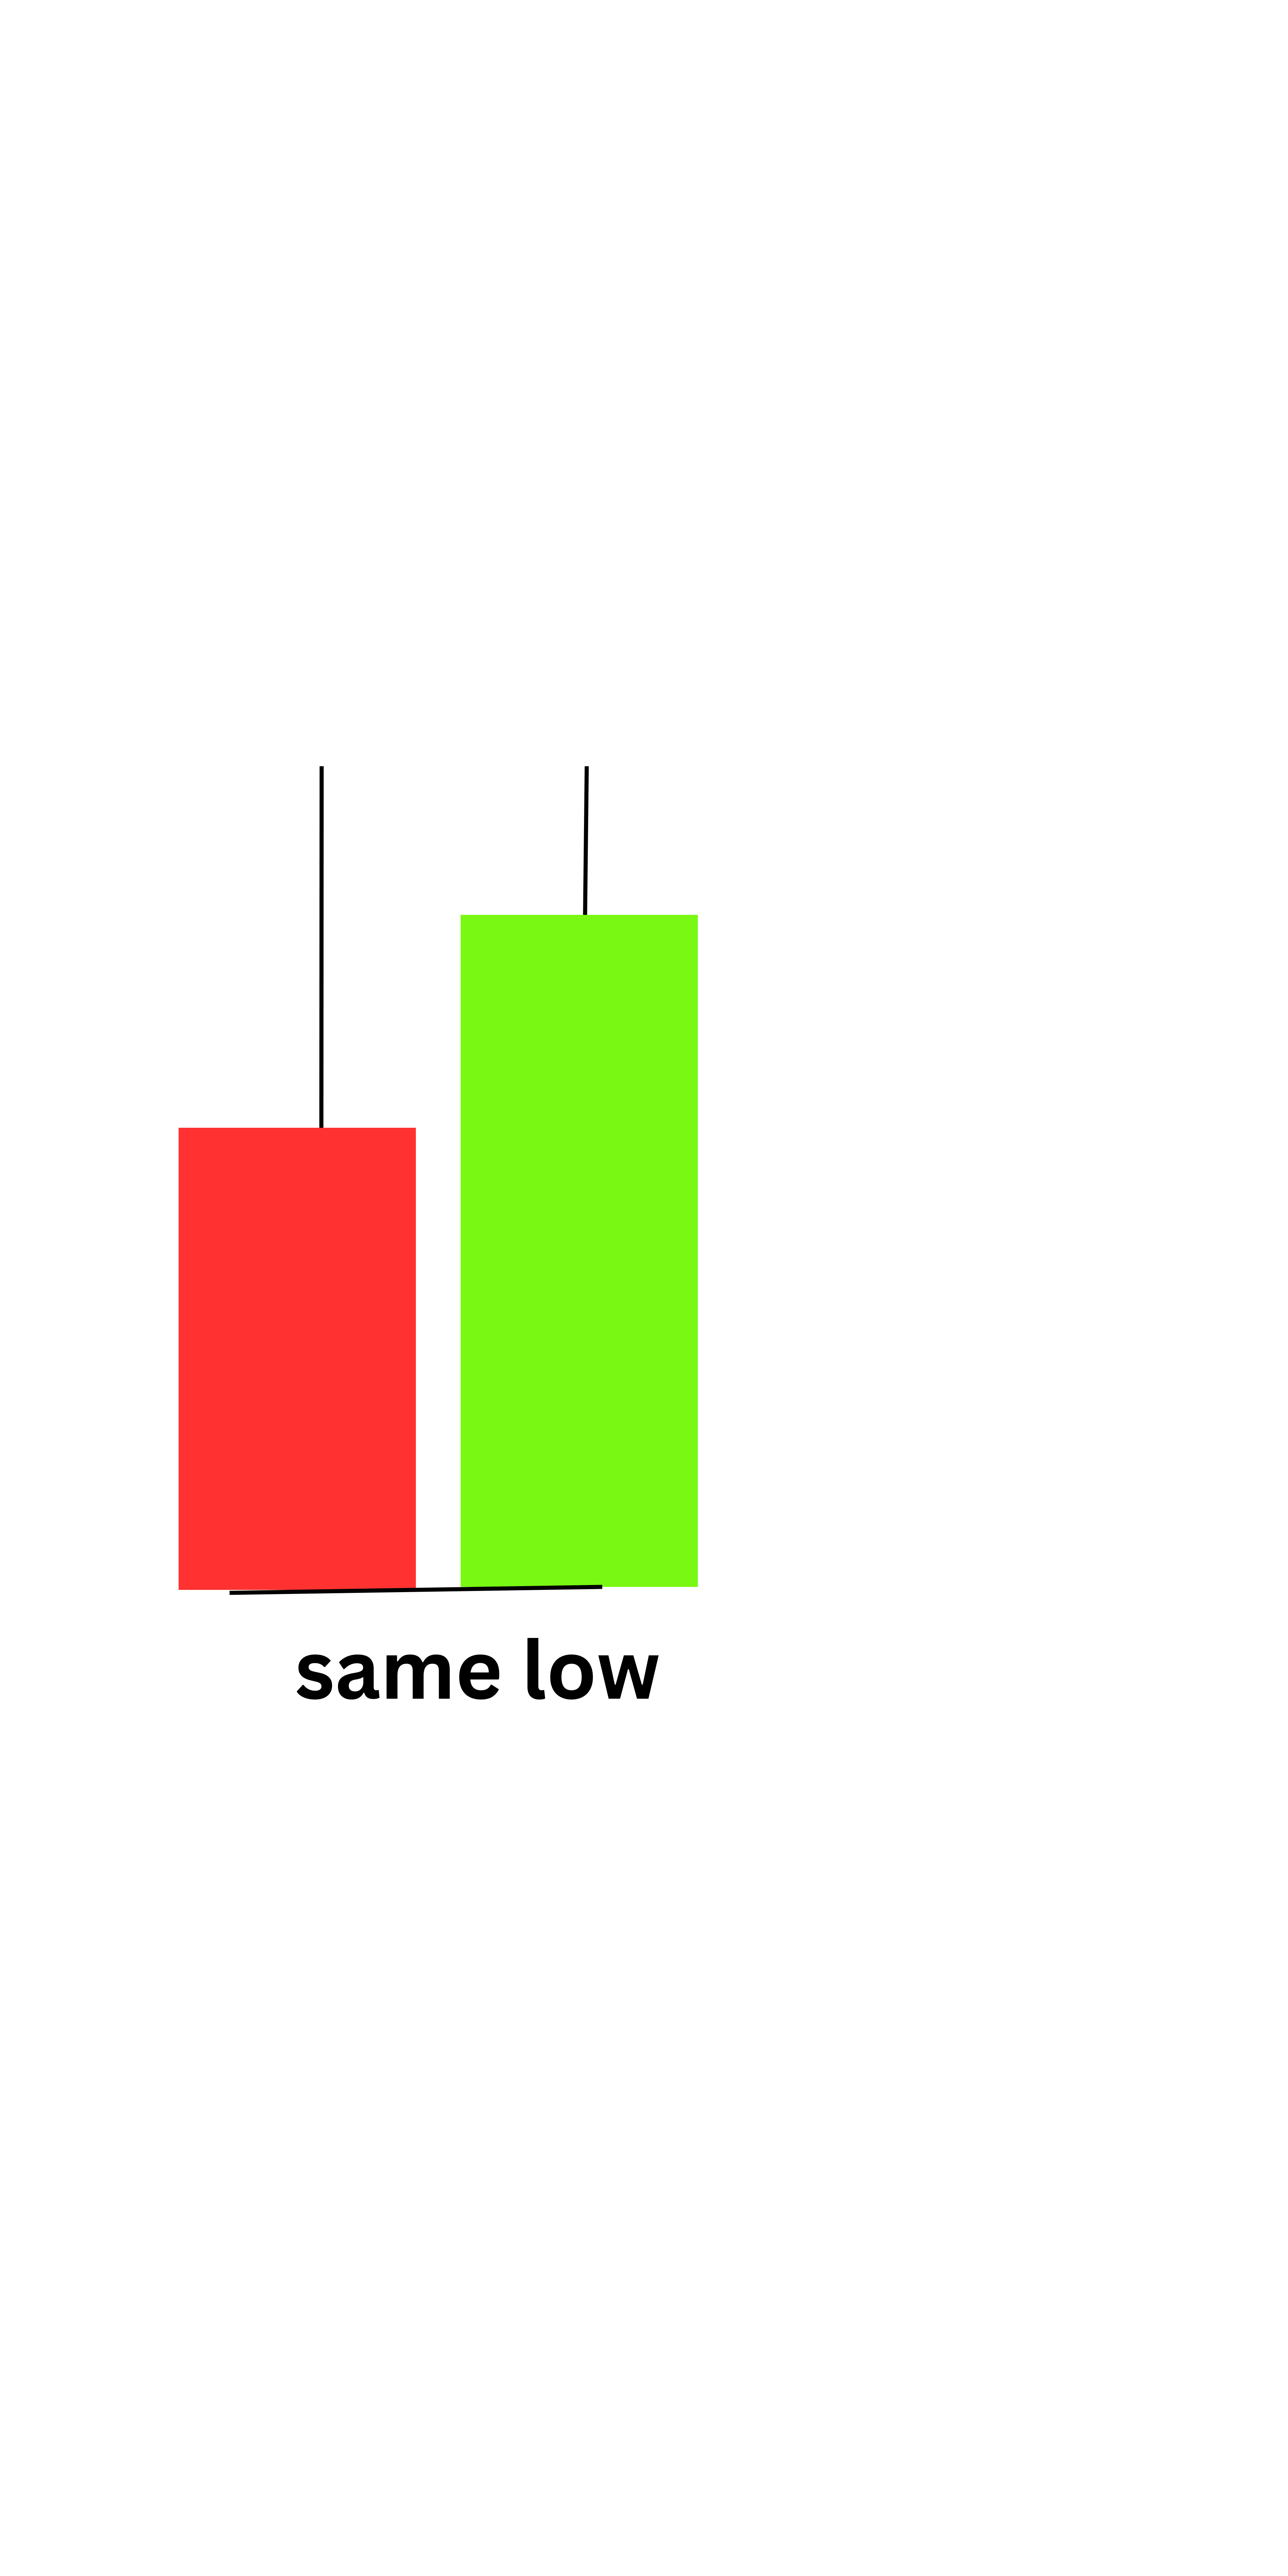
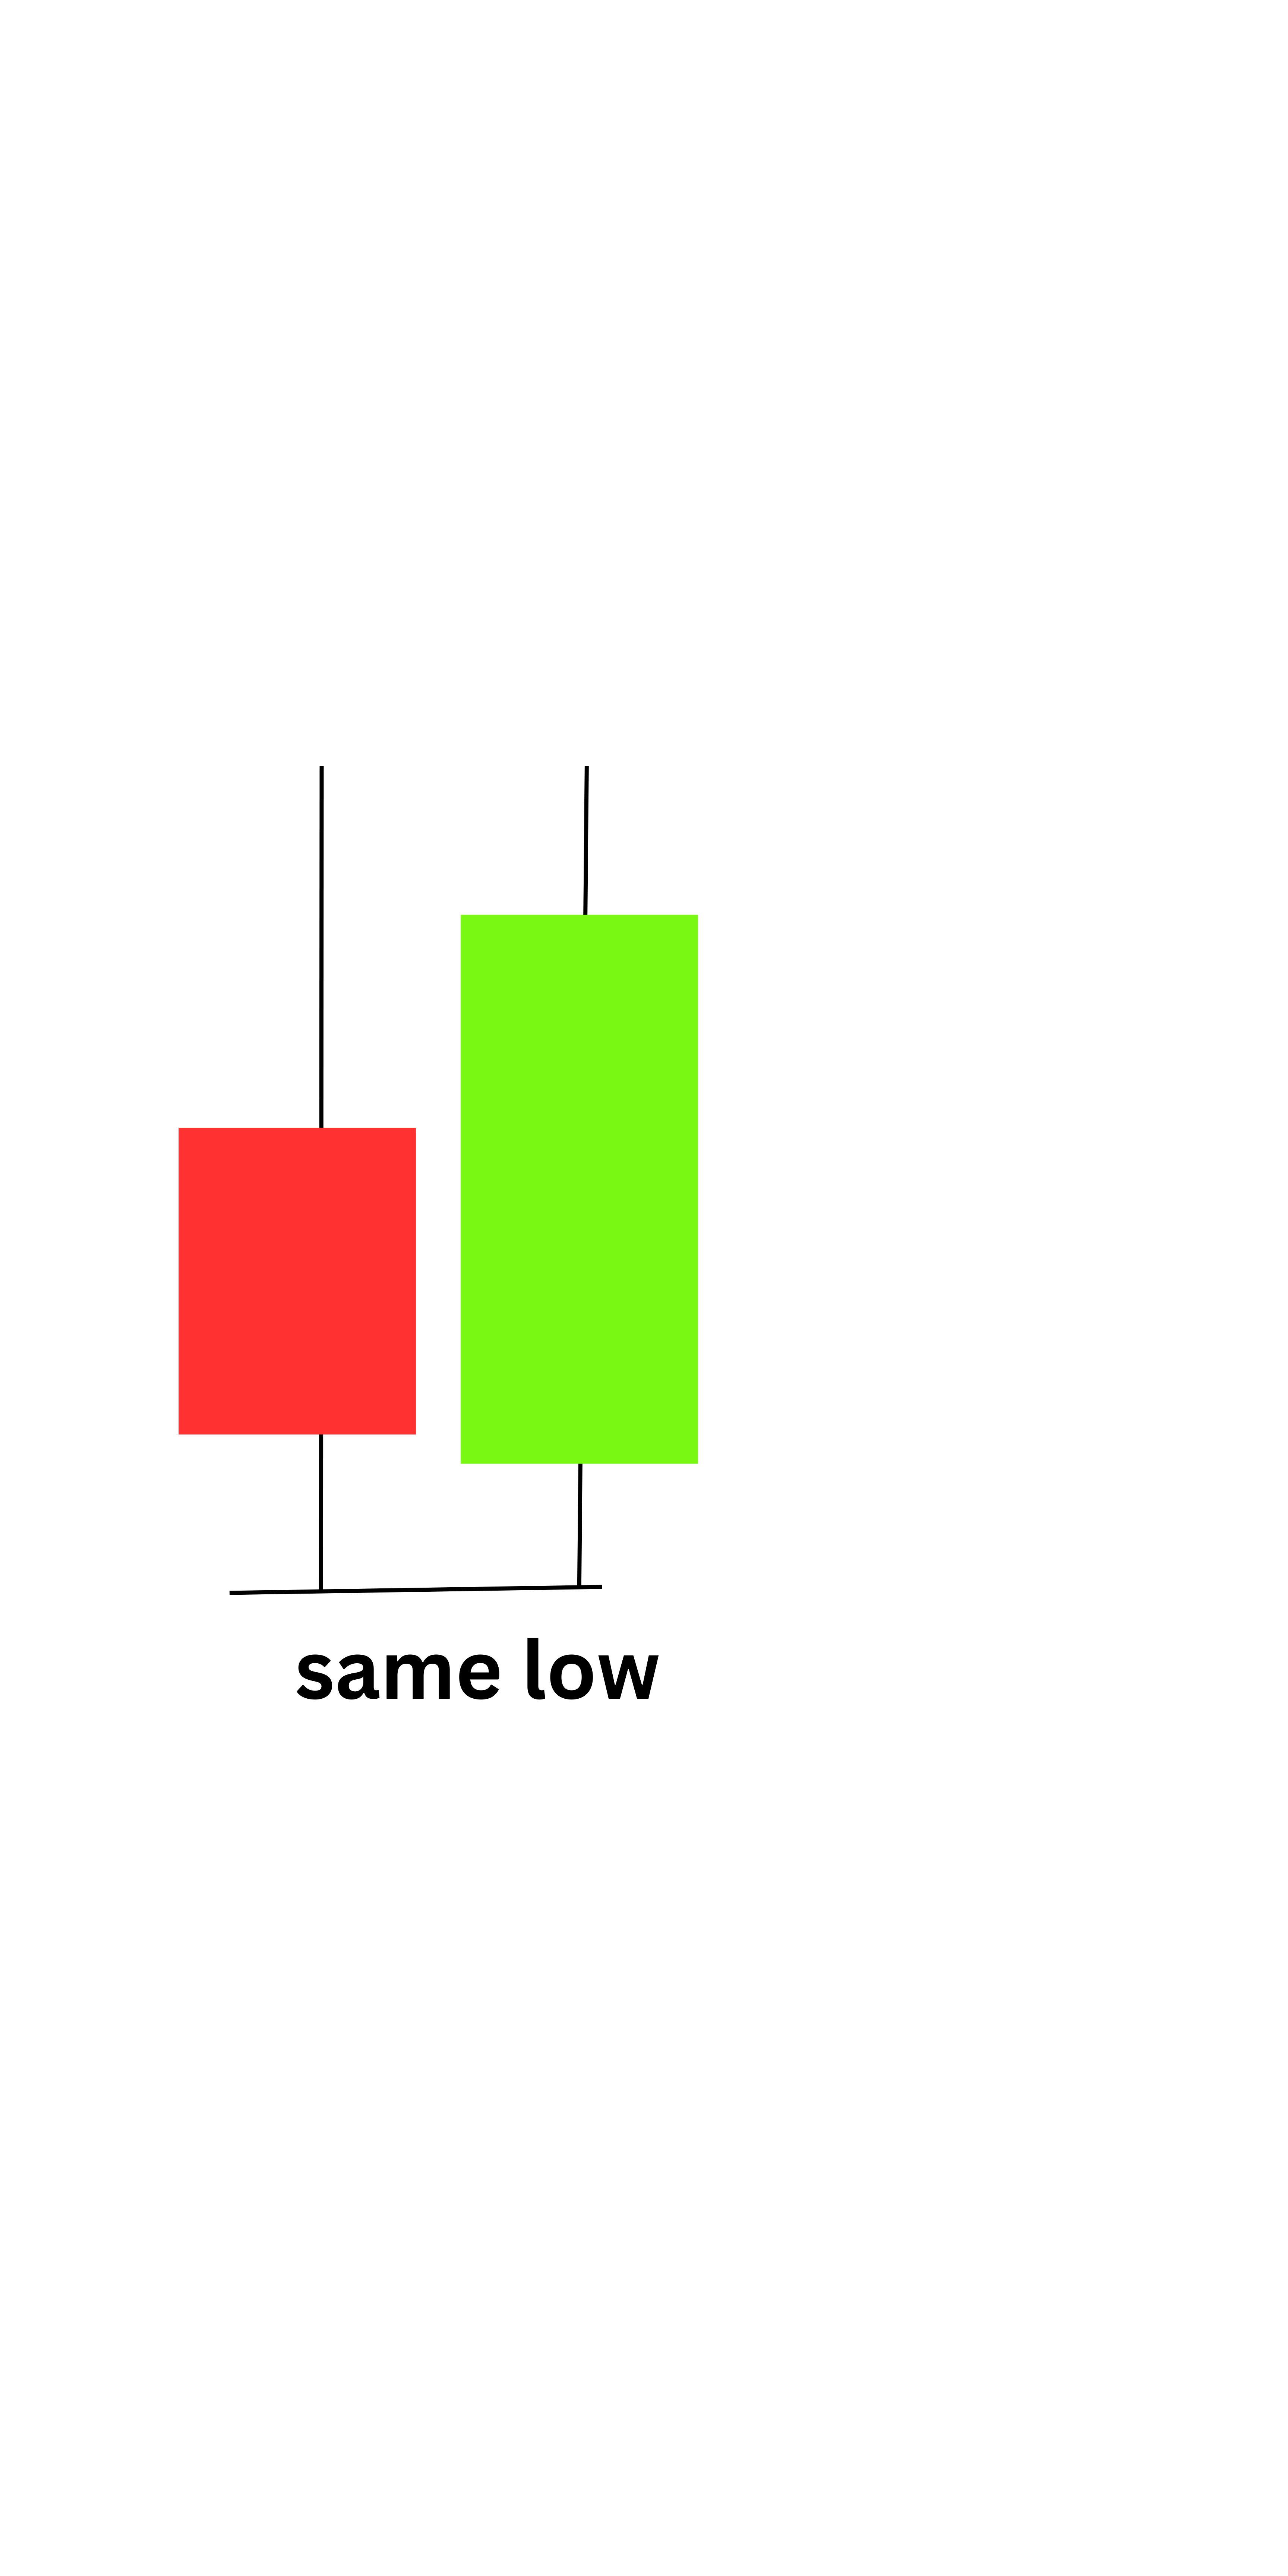
- Description: Tweezer tops occur when two consecutive candles have nearly identical highs, while tweezer bottoms form when two candles have nearly identical lows.
- Significance:
- Tweezer Tops: Bearish reversal near resistance.
- Tweezer Bottoms: Bullish reversal near support.
- Entry Point: Enter after confirmation of the reversal direction by the following candle.
12. Inside Bar (Consolidation Breakout)
- Description: An inside bar is a candle whose range (high to low) is entirely within the range of the previous candle.
- Significance: Indicates consolidation and potential breakout.
- Entry Point: Enter on the breakout of the inside bar’s range, in the direction of the trend.
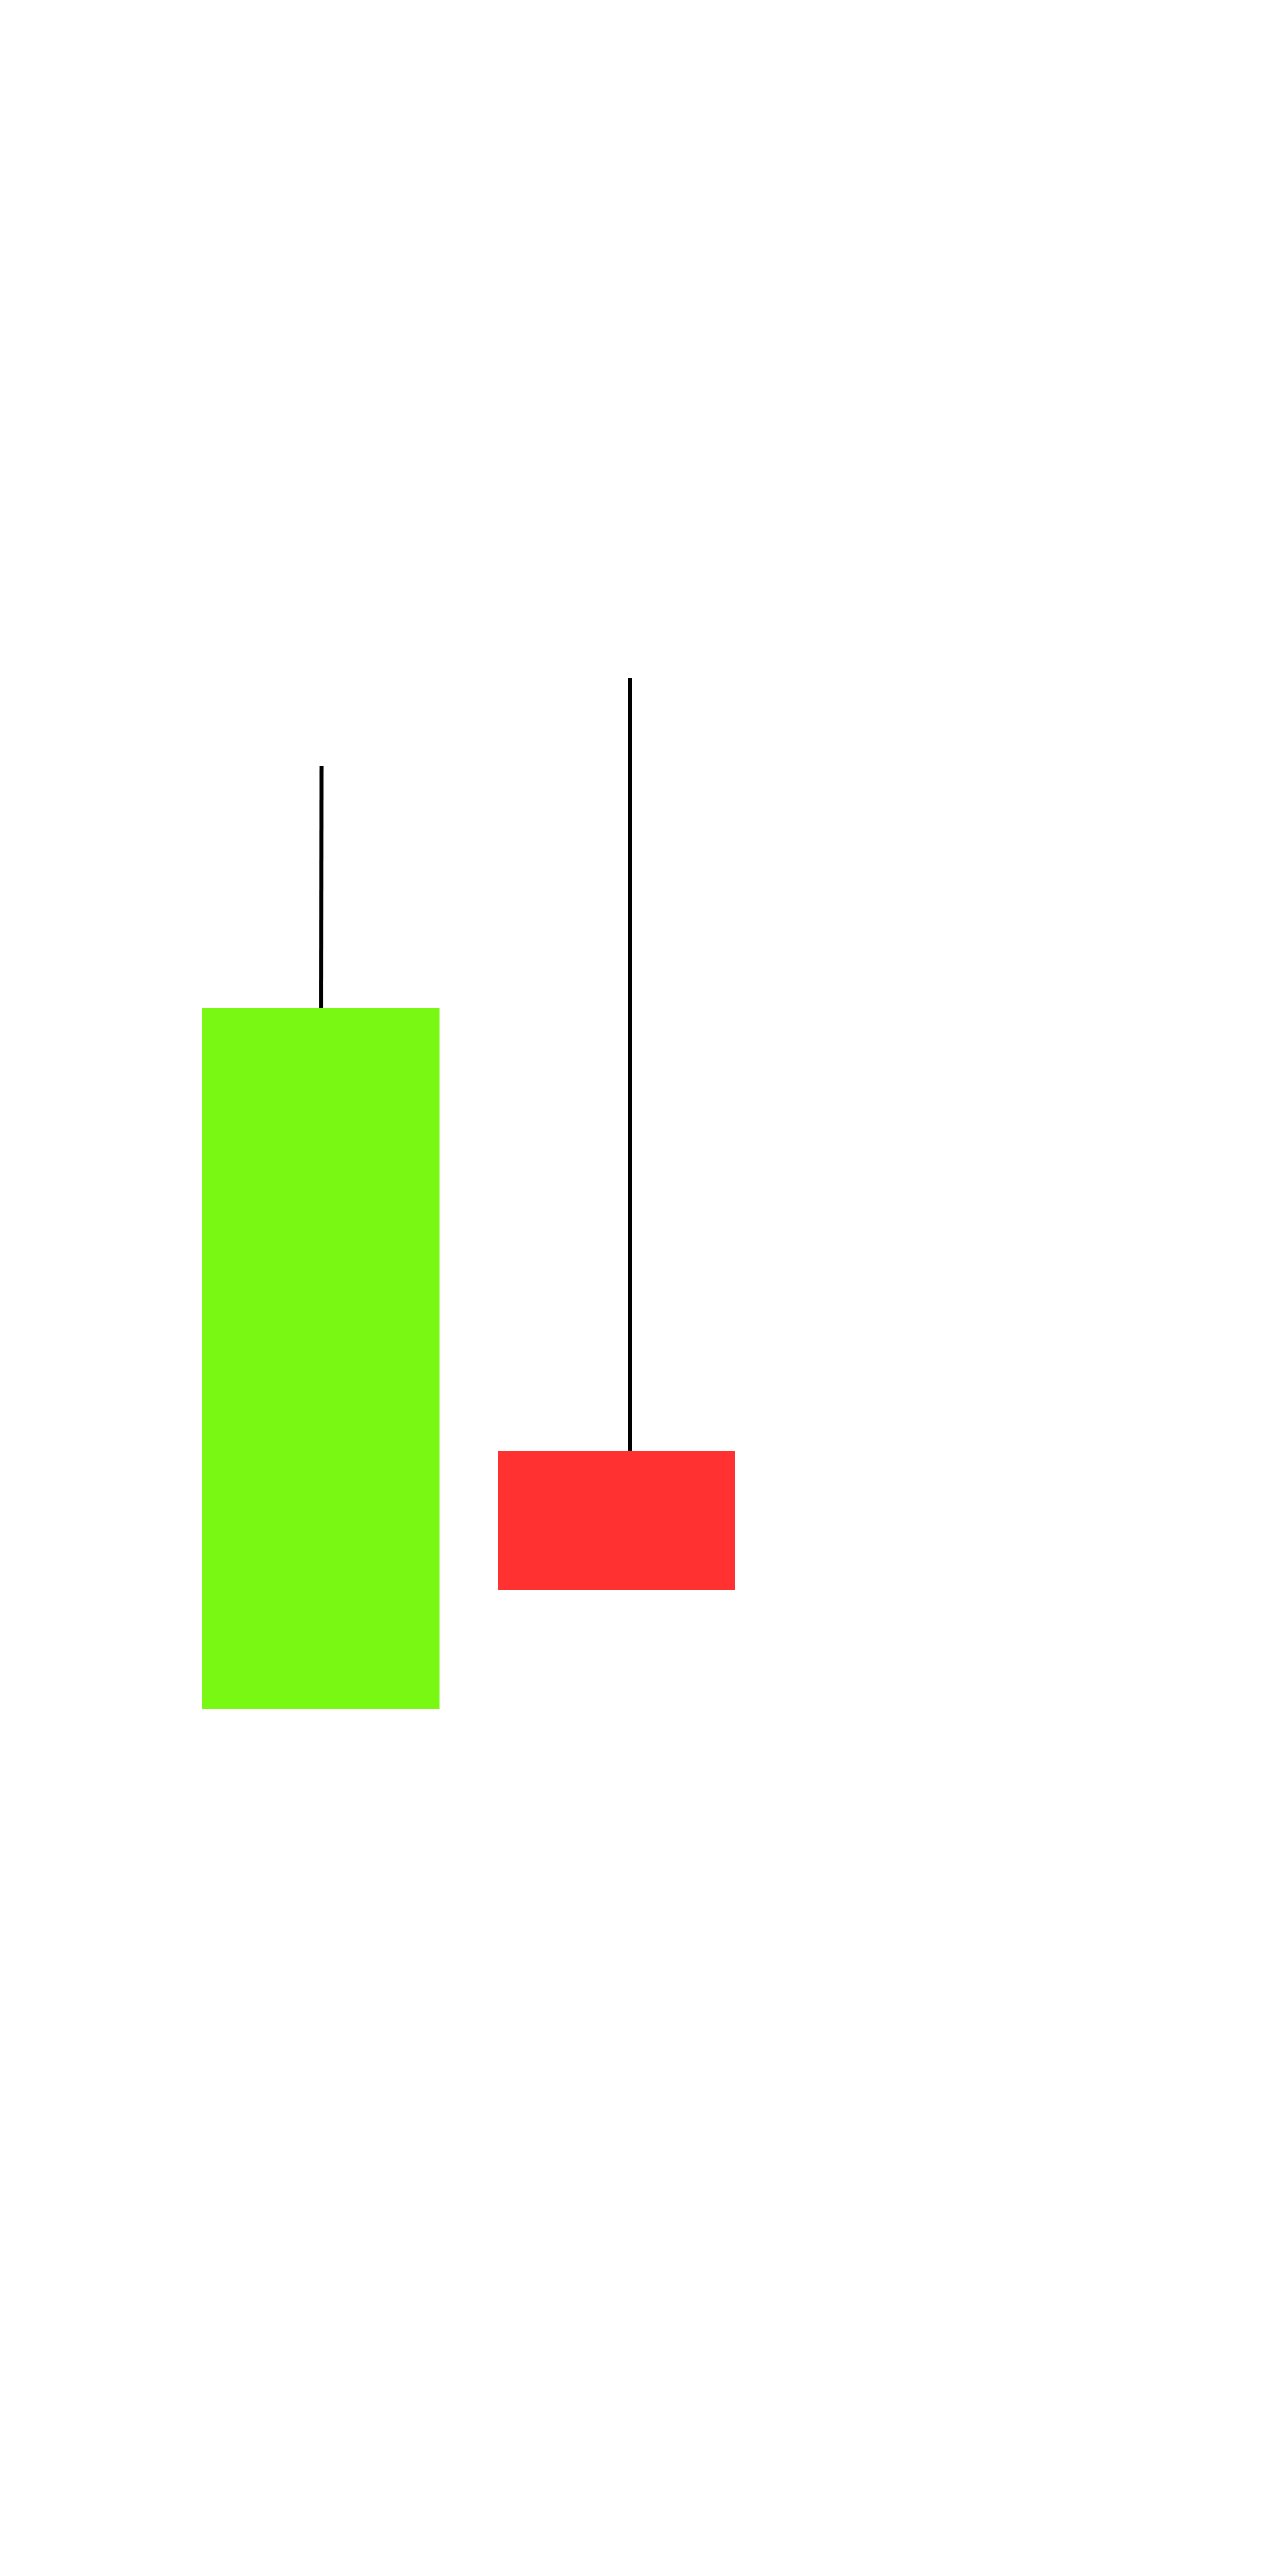
13. Pin Bar (Reversal or Continuation)
- Description: A pin bar has a small body and a long wick, signifying rejection of higher or lower prices.
- Significance:
- Bullish Pin Bar: Reversal to the upside.
- Bearish Pin Bar: Reversal to the downside.
- Entry Point: Enter in the direction indicated by the wick rejection, after confirmation.

Conclusion
Candlestick patterns are a powerful tool for identifying entry points in trading. However, it’s crucial to pair them with other forms of analysis, such as support and resistance, trendlines, and indicators like RSI or moving averages. Always confirm the pattern with volume and avoid trading solely based on candlesticks in isolation. The color doesn’t usually matter as long as they are at key levels. candles may not come out as picture- perfect as we see them on the internet but understanding them and the reason as to why they are some points will improve your trading experience
Mastering these patterns can significantly improve your trading accuracy and profitability, especially when combined with a disciplined approach and effective risk management.

Leave a Reply
You must be logged in to post a comment.