Price action trading is one of the most effective and widely used strategies in trading. It focuses on analyzing price movement without relying heavily on indicators, making it a pure and straightforward approach. Whether you’re trading forex, stocks, or synthetic indices, mastering price action can significantly improve your trading skills.
This article dives deep into the principles, strategies, terminologies, candlestick patterns, and chart patterns associated with price action trading.
What is Price Action Trading?
Price action trading is a strategy that involves analyzing historical price movements to predict future trends. Instead of relying on lagging indicators, traders focus on raw price data represented by candlesticks, bars, or line charts.
Key highlights of price action trading:
- No Indicators: Relies solely on price charts and patterns.
- Universal Application: Works across all markets and timeframes.
- Focus on Psychology: Helps traders understand market sentiment and behavior.
Essential Price Action Terminologies
To grasp price action trading, familiarize yourself with these key terms:
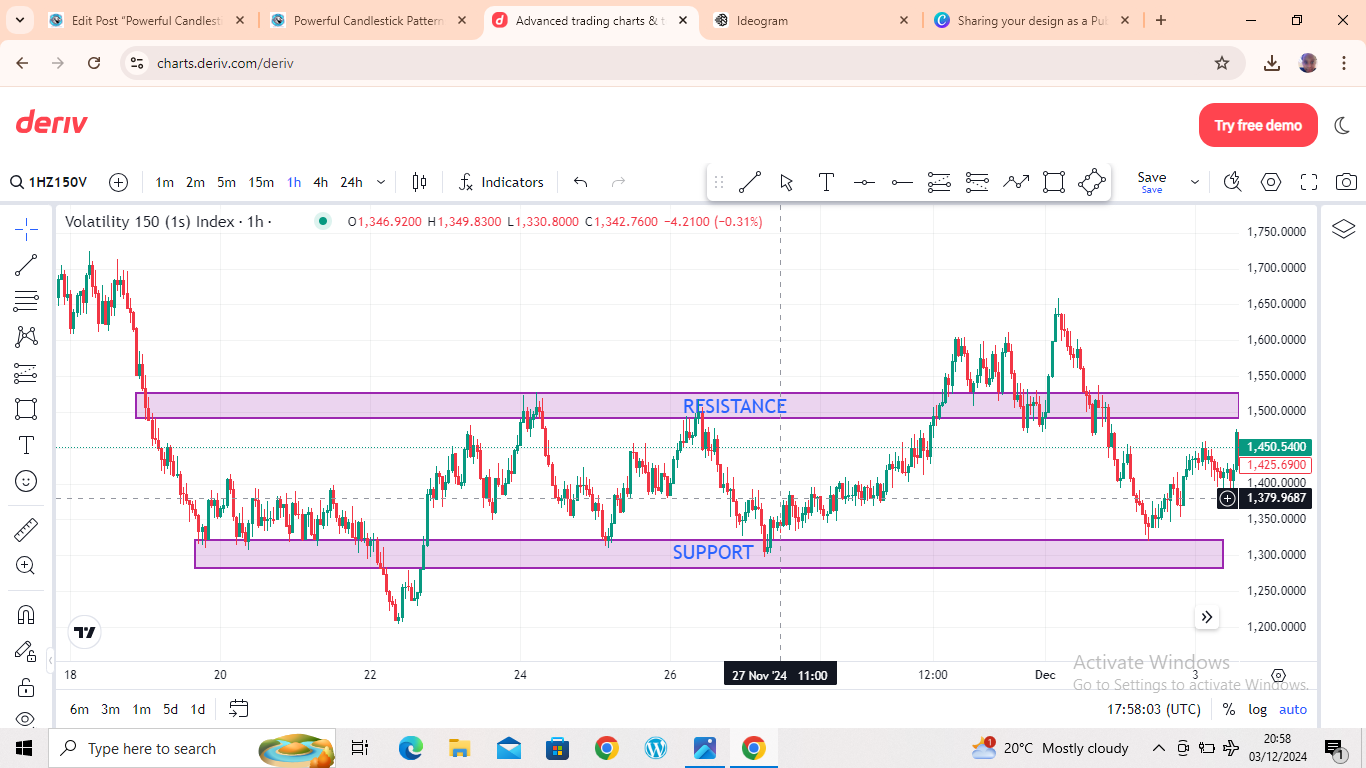
- Support and Resistance:
- Support: A price level where buying pressure prevents the price from falling further.
- Resistance: A price level where selling pressure prevents the price from rising further.

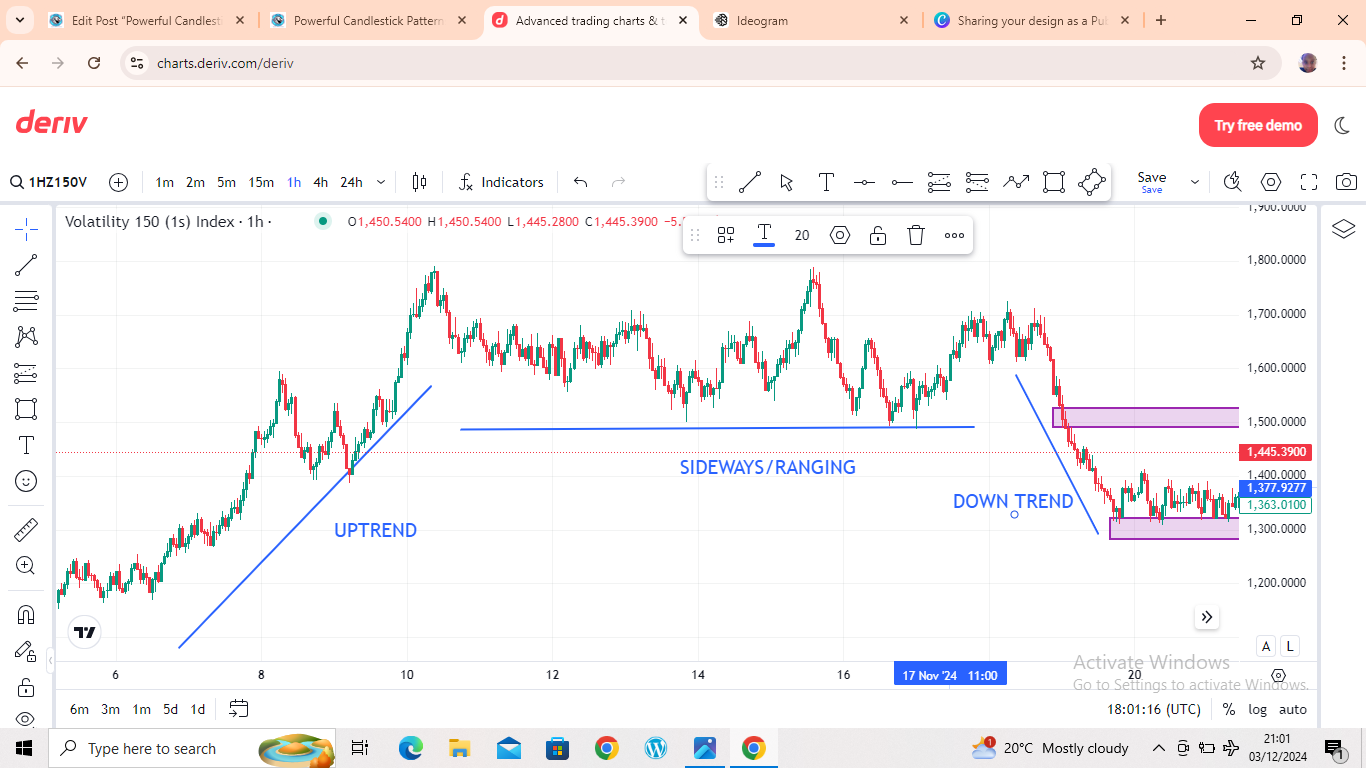
- Trend:
- Uptrend: A series of higher highs (HH) and higher lows (HL).
- Downtrend: A series of lower highs (LH) and lower lows (LL).
- Sideways Trend: Price moves within a range without a clear direction.

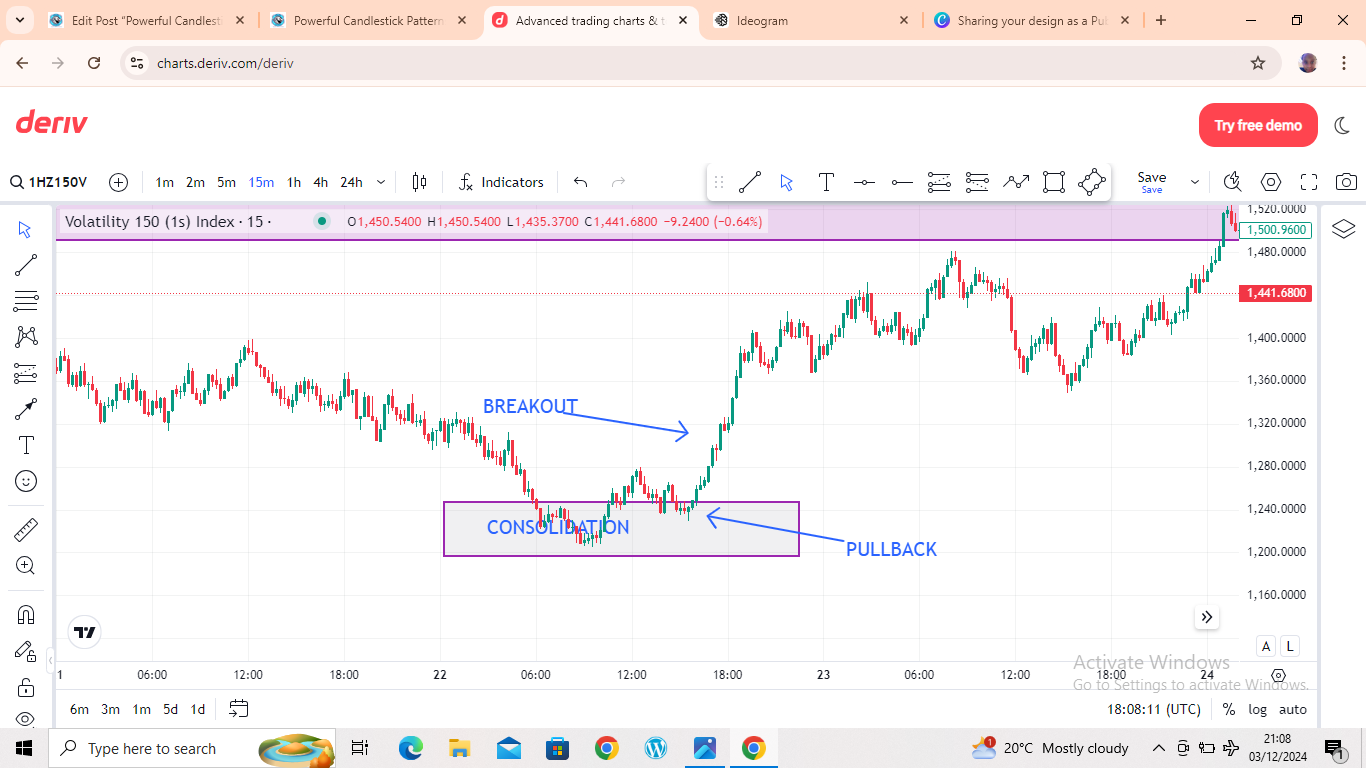
- Breakout: When price moves beyond a defined support or resistance level.
- Pullback: A temporary reversal in the direction of a trend.
- Consolidation: A period of low volatility where price moves sideways.

Key Candlestick Patterns in Price Action Trading
Candlestick patterns are the foundation of price action trading. They reflect market sentiment and predict potential reversals or continuations.
Reversal Patterns
- Hammer and Inverted Hammer:
- Hammer: Found at the bottom of a downtrend, indicating a potential reversal upward.
- Inverted Hammer: Found at the bottom of a downtrend, signaling possible bullish reversal.
- Shooting Star and Hanging Man:
- Shooting Star: Found at the top of an uptrend, suggesting a bearish reversal.
- Hanging Man: Found at the top of an uptrend, also indicating a bearish reversal.
- Engulfing Patterns:
- Bullish Engulfing: A large bullish candle completely engulfs the previous bearish candle.
- Bearish Engulfing: A large bearish candle completely engulfs the previous bullish candle.
- Doji: Indicates indecision in the market. Can signal reversals or continuation depending on context.
Continuation Patterns
- Marubozu:
- Strong bullish or bearish momentum with no wicks.
- Spinning Top:
- Indicates indecision but often occurs during consolidation before continuation.
Refer to Powerful Candlestick Patterns That Provide Entries
Key Chart Patterns in Price Action Trading
Chart patterns are broader formations that occur over multiple candles, indicating potential market movements.
Reversal Patterns
- Head and Shoulders:
- A bearish reversal pattern with three peaks: a higher middle peak (head) and two lower peaks (shoulders).
- Inverse Head and Shoulders:
- A bullish reversal pattern similar to the head and shoulders but inverted.
- Double Top and Double Bottom:
- Double Top: A bearish pattern formed by two peaks at a similar level.
- Double Bottom: A bullish pattern formed by two troughs at a similar level.
- Triple Top and Triple Bottom:
- Similar to double tops/bottoms but with three peaks or troughs.
Continuation Patterns
- Flags and Pennants:
- Flag: A small channel sloping against the prevailing trend.
- Pennant: A small symmetrical triangle forming after a sharp move.
- Ascending and Descending Triangles:
- Ascending Triangle: Bullish continuation pattern with a flat top and ascending trendline.
- Descending Triangle: Bearish continuation pattern with a flat bottom and descending trendline.
- Wedges:
- Rising Wedge: Bearish pattern indicating potential reversal downward.
- Falling Wedge: Bullish pattern indicating potential reversal upward.
- Rectangles:
- Price consolidates within a range before breaking out in the direction of the prevailing trend.
Popular Price Action Strategies
1. Pin Bar Strategy
- A pin bar indicates rejection of a price level and potential reversal.
- How to Trade: Enter in the direction of the long wick after confirmation from the next candle.
2. Inside Bar Strategy
- An inside bar forms when the current candle’s range is within the previous candle’s range.
- How to Trade: Wait for a breakout above or below the mother candle.
3. Trendline Trading
- Draw trendlines connecting higher lows (uptrend) or lower highs (downtrend).
- How to Trade: Buy at the trendline in an uptrend, and sell at the trendline in a downtrend.
4. Breakout and Retest
- Identify a breakout beyond support or resistance.
- How to Trade: Wait for the price to retest the broken level and then trade in the breakout’s direction.
Advantages of Price Action Trading
- Simplicity: No complex indicators—just clean charts.
- Universality: Works on all instruments and timeframes.
- Real-Time Analysis: Provides immediate insights into market sentiment.
- Improved Decision-Making: Traders develop a deeper understanding of price behavior.
Final Thoughts
Price action trading is an invaluable strategy that empowers traders to read and react to market movements. By mastering candlestick patterns, chart formations, and key strategies, you can develop a trading edge without relying on lagging indicators.
Whether you’re a beginner or an experienced trader, incorporating price action into your approach will help you navigate markets with confidence. Start practicing today, and let the charts guide your decisions!


Leave a Reply
You must be logged in to post a comment.